CS107
CS107 is the third course in Stanford’s introductory programming sequence. The CS106 courses provide you with a solid foundation in programming methodology and abstractions, and CS107 follows on this to build up and expand your breadth and depth of programming experience and techniques. The course will work from the C programming language down to the microprocessor to de-mystify the machine. With a complete understanding of how computer systems execute programs and manipulate data, you will become a more effective programmer, especially in dealing with issues of debugging, performance, portability, and robustness. Topics covered include: the C programming language, data representation, machine-level code, computer arithmetic, elements of code compilation, optimization of memory and runtime performance, and memory organization and management.
The class has two lectures a week and a weekly lab designed for hands-on learning and experimentation. There will be significant programming assignments and you can expect to work hard and be challenged by this course. Your effort can really pay off - once you master the machine and advance your programming skills to the next level, you will have powerful mojo to bring to any future project!
Notes
The best course I have learned about C programming language.
Some readings are copied from COMP201
What is Unix?
Unix: a set of standards and tools commonly used in software development.
- Macs are built on top of Unix
- Linux is built on top of Unix
Every Unix system works with the same tools and commands
What is the Command Line?
The command-line is a text-based interface to navigate a computer, instead of a Graphical User Interface (GUI).
The C Language
C was created around 1970 to make writing Unix and Unix tools easier.
C doesn’t have
- More advanced features like operator overloading, default arguments, pass by reference, classes and objects, ADTs, etc.
- Extensive libraries (no graphics, networking, etc.) – this means not much to learn C!
- many compiler and runtime checks (this may cause security vulnerabilities!)
C is procedural: you write functions, rather than define new variable types with classes and call methods on objects. C is small, fast and efficient.
/*
* hello.c
* This program prints a welcome message
* to the user.
*/
#include <stdio.h> // for printf
int main(int argc, char *argv[]) {
    printf("Hello, world!\n");
    return 0;
}
Import statements: C libraries are written with angle brackets. Local libraries have quotes: #include “lib.h”
Main function – entry point for the program Should always return an integer (0 = success)
Main parameters – main takes two parameters, both relating to the command line arguments used to execute the program. argc is the number of arguments in argv
argv is an array of arguments (char * is C string)
Boolean Variables
To make Boolean variables, (e.g. bool b = ____), you must import stdbool.h:
#include <stdbool.h> // for bool
ccc
Readings
The Strange Birth and Long Life of Unix “A damn stupid thing to do”—the origins of C
Number Representations
Signed Integers
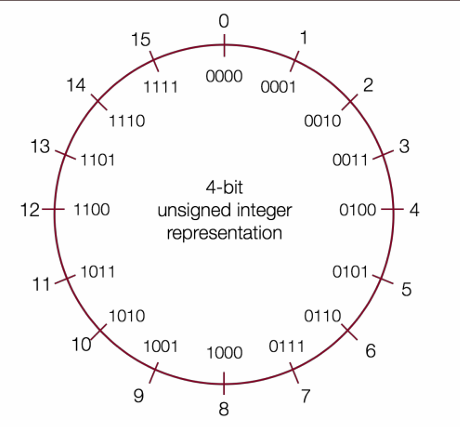
We’ve only represented 15 of our 16 available numbers!
| Decimal | Positive | Negative |
|---|---|---|
| 0 | 0000 | 0000 |
| 1 | 0001 | 1111 |
| 2 | 0010 | 1110 |
| 3 | 0011 | 1101 |
| 4 | 0100 | 1100 |
| 5 | 0101 | 1011 |
| 6 | 0110 | 1010 |
| 7 | 0111 | 1001 |
| 8 | 1000 | 1000 |
| 9 | 1001(same as -7!) | NA |
| 10 | 1010(same as -6!) | NA |
| 11 | 1011(same as -5!) | NA |
| 12 | 1100(same as -4!) | NA |
| 13 | 1101(same as -3!) | NA |
| 14 | 1110(same as -2!) | NA |
| 15 | 1111(same as -1!) | NA |
two’s complement
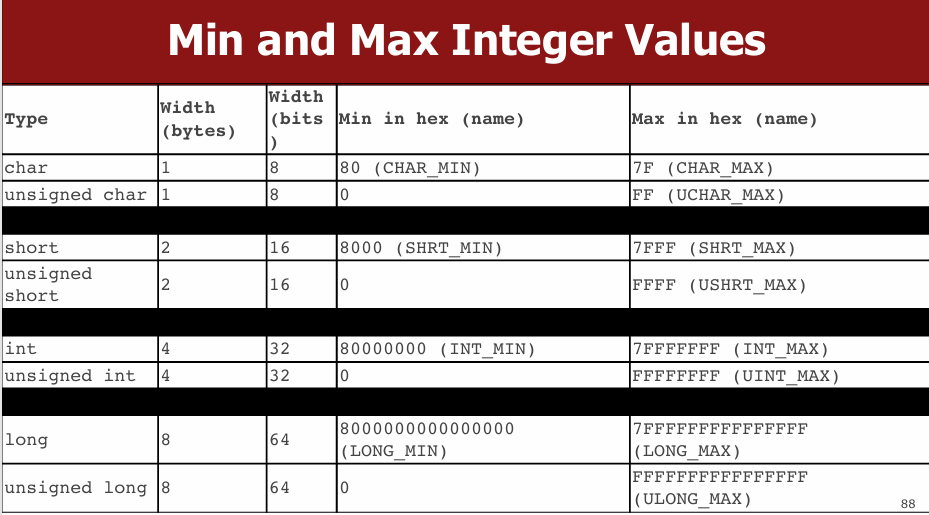
Overflow and Underflow
If you exceed the maximum value of your bit representation, you wrap around or overflow back to the smallest bit representation.
If you go below the minimum value of your bit representation, you wrap around or underflow back to the largest bit representation.
Casting
What happens at the byte level when we cast between variable types? The bytes remain the same! This means they may be interpreted differently depending on the type.
C will implicitly cast the signed argument to unsigned, and then performs the operation assuming both numbers are non-negative.
Truncating Bit Representation
If we want to reduce the bit size of a number, C truncates the representation and discards the more significant bits.
unsigned int x = 128000;
unsigned short sx = x;
unsigned int y = sx;
What happens here? Let’s look at the bits in x (a 32-bit unsigned int), 128000:
0000 0000 0000 0001 1111 0100 0000 0000
When we cast x to a short, it only has 16-bits, and C truncates the number:
1111 0100 0000 0000
This is 62464! Unsigned numbers can lose info too. Here is what y looks like:
0000 0000 0000 0000 1111 0100 0000 0000// still 62464
readings
Map 256 Glitch To keep a Boeing Dreamliner flying, reboot once every 248 days Comair/Delta airline debacle caused by the overflow of 16-bit pointer Why Gandhi Is Such An Asshole In Civilization CVE-2019-3857
printf and Integers
As long as the value is a 32-bit type, printf will treat it according to the placeholder!
Expanding Bit Representations
We might not be able to convert from a bigger data type to a smaller data type, but we do want to always be able to convert from a smaller data type to a bigger data type. For unsigned values, we can add leading zeros to the representation (“zero extension”) For signed values, we can repeat the sign of the value for new digits (“sign extension”)
Bitwise Operators
You’re already familiar with many operators in C:
- Arithmetic operators: +, -, *, /, %
- Comparison operators: ==, !=, <, >, <=, >=
- Logical Operators: &&, ||, !
char
A char is a variable type that represents a single character or “glyph”.
Under the hood, C represents each char as an integer (its “ASCII value”).
Lowercase letters are 32 more than their uppercase equivalents (bit flip!)
char uppercaseA = 'A';// Actually 65
char lowercaseA = 'a';// Actually 97
char zeroDigit = '0’;// Actually 48
// prints out every lowercase character
for (char ch = 'a'; ch <= 'z'; ch++) {
    printf("%c", ch);
}
Common ctype.h Functions
| Function | Description |
|---|---|
| isalpha(ch) | true if chis ’a’through ‘z’ or ’A’through ‘Z’ |
| islower(ch) | true if chis ’a’through ‘z’ |
| isupper(ch) | true if chis ’A’through ‘Z’ |
| isspace(ch) | true if chis a space, tab, new line, etc. |
| isdigit(ch) | true if chis ’0’through ‘9’ |
| toupper(ch) | returns uppercase equivalent of a letter |
| tolower(ch) | returns lowercase equivalent of a letter |
Remember: these returnthe new char, they cannot modify an existing char!
String Length
terminate every string with a ‘\0’ character.
Caution: strlen is O(N) because it must scan the entire string!
Save the value if you plan to refer to the length later.
C Strings As Parameters
When you pass a string as a parameter, it is passed as a char *. C passes the location of the first character rather than a copy of the whole array.
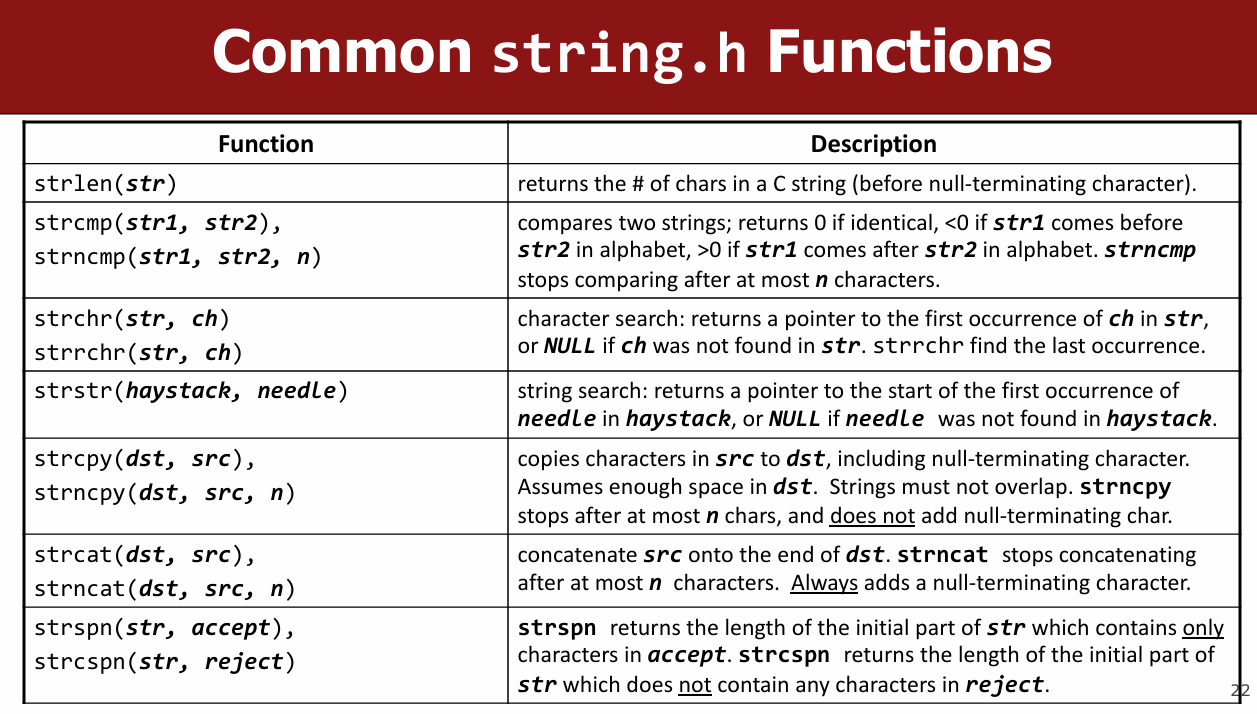
Common string.h Functions
Arrays of Strings
You can make an array of strings to group multiple strings together:
char *stringArray[5]; // space to store 5 char *s
You can also use the following shorthand to initialize a string array:
char *stringArray[] = {
    "my string 1",
    "my string 2",
    "my string 3"
};
Pointers
- A pointer is a variable that stores a memory address.
- Because there is no pass-by-reference in C like in C++, pointers let us pass around the address of one instance of memory, instead of making many copies.
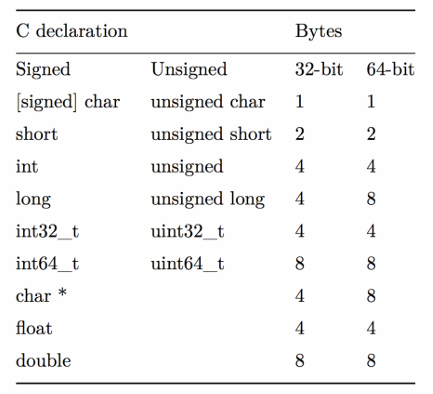
- One (8 byte) pointer can refer to any size memory location!
Character Arrays
When you declare an array of characters, contiguous memory is allocated on the stack to store the contents of the entire array.
An array variable refers to an entire block of memory. You cannot reassign an existing array to be equal to a new array.
char str[6] = "apple";
char str2[8] = "apple 2";
str = str2; // not allowed!
An array’s size cannot be changed once you create it; you must create another new array instead.
char *
When you declare a char pointer equal to a string
literal, the characters are not stored on the stack.
Instead, they are stored in a special area of
memory called the “data segment”. You cannot
modify memory in this segment.
sizeof
A char array is not a pointer; it refers to the entire array contents. In fact, sizeof returns the size of the entire array!
Pointer Arithmetic
When you do pointer arithmetic (with either a pointer or an array), you are adjusting the pointer by a certain number of places (e.g. characters).
Strings as Parameters
When you pass a char * string as a parameter, C makes a copy of the address stored in the char *, and passes it to the function. This means they both refer to the same memory location.
When you pass a char array as a parameter, C makes a copy of the address of the first array
Arrays of Strings
You can make an array of strings to group multiple strings together:
char *stringArray[5]; // space to store 5 char *s
Here’s an ASCII diagram to illustrate the memory layout:
stringArray: [ ptr1 ] [ ptr2 ] [ ptr3 ] [ ptr4 ] [ ptr5 ]
               ↓        ↓        ↓        ↓        ↓
             NULL     NULL     NULL     NULL     NULL
You can also use the following shorthand to initialize a string array:
char *stringArray[] = {
    "my string 1",
    "my string 2",
    "my string 3"
};
stringArray: [ ptr1 ] [ ptr2 ] [ ptr3 ]
               ↓        ↓        ↓
           "my string 1" "my string 2" "my string 3"
Pointers
- A pointer is a variable that stores a memory address.
- Because there is no pass-by-reference in C like in C++, pointers let us pass around the address of one instance of memory, instead of making many copies.
Here’s an example of a pointer pointing to an integer:
int x = 42;
int *ptr = &x;
x:   [ 42 ]
ptr: [ &x ] → [ 42 ]
- One (8 byte) pointer can refer to any size memory location!
Character Arrays
When you declare an array of characters, contiguous memory is allocated on the stack to store the contents of the entire array.
char str[6] = "apple";
str: [ 'a' ] [ 'p' ] [ 'p' ] [ 'l' ] [ 'e' ] [ '\0' ]
An array variable refers to an entire block of memory. You cannot reassign an existing array to be equal to a new array.
char str[6] = "apple";
char str2[8] = "apple 2";
str = str2; // not allowed!
An array’s size cannot be changed once you create it; you must create another new array instead.
char *
When you declare a char pointer equal to a string literal, the characters are not stored on the stack. Instead, they are stored in a special area of memory called the “data segment”. You cannot modify memory in this segment.
char *str = "apple";
str: [ ptr ] → "apple" (in data segment)
sizeof
A char array is not a pointer; it refers to the entire array contents. In fact, sizeof returns the size of the entire array!
char str[6] = "apple";
printf("%zu\n", sizeof(str)); // Outputs 6
str: [ 'a' ] [ 'p' ] [ 'p' ] [ 'l' ] [ 'e' ] [ '\0' ]
sizeof(str): 6
Pointer Arithmetic
When you do pointer arithmetic (with either a pointer or an array), you are adjusting the pointer by a certain number of places (e.g., characters).
char str[] = "hello";
char *ptr = str;
ptr += 2;
str: [ 'h' ] [ 'e' ] [ 'l' ] [ 'l' ] [ 'o' ] [ '\0' ]
ptr:               ↑
Strings as Parameters
When you pass a char * string as a parameter, C makes a copy of the address stored in the char *, and passes it to the function. This means they both refer to the same memory location.
void printString(char *str) {
    printf("%s\n", str);
}
str (in function): [ ptr ] → original string
When you pass a char array as a parameter, C makes a copy of the address of the first array element, and passes it (as a char *) to the function.
void printString(char str[]) {
    printf("%s\n", str);
}
str (in function): [ ptr ] → original array
Strings and Memory
These memory behaviors explain why strings behave the way they do:
- If we make a variable to store a string literal that is a char[], we can modify the characters because its memory lives in our stack space.
- If we make a variable to store a string literal that is a char *, we cannot modify the characters because its memory lives in the data segment.
- We can set a char*equal to another value, because it is just a pointer.
- We cannot set a char[] equal to another value, because it is not a pointer; it refers to the block of memory reserved for the original array.
- If we change characters in a string passed to a function, these changes will persist outside of the function.
- When we pass a char array as a parameter, we can no longer use sizeof to get its full size.
C Parameters
If you are performing an operation with some input and do not care about any changes to the input, pass the data type itself.
If you are modifying a specific instance of some value, pass the location of what you would like to modify.
STACK
Address     Value
--------    ------
0x1f0       3       <- x
0x10        0x1f0   <- intPtr (pointer to x)
Why Use Pointers?
Enables pass-by-reference style (not native in C).
Efficient for memory manipulation.
Required for working with dynamically allocated memory.
When to Pass by Value vs. Pointer
| Intent | How to Pass | Example |
|---|---|---|
| Read-only access | Value | int x |
| Modify caller’s variable | Pointer | int *x |
void doubleNum(int *x) {
    *x = *x * 2;
}

int main() {
    int num = 2;
    doubleNum(&num);
    printf("%d", num);  // Prints 4
}
Arrays and Memory
Arrays Are Contiguous Memory Blocks
char str[] = "apple"; // 'a' 'p' 'p' 'l' 'e' '\0'
Array Behavior
- Cannot reassign array: nums = nums2; is illegal.
- sizeof(array) gives full size only inside the same scope
- Array Passed to Function Becomes Pointer
void myFunc(char *str) {
    // sizeof(str) == 8, just a pointer
}
example:
char str[] = "apple";

Address     Value
--------    ------
0x100       'a'
0x101       'p'
0x102       'p'
0x103       'l'
0x104       'e'
0x105       '\0'
Pointer Arithmetic Visualization
char *str = "apple";  // stored in .data segment

str + 1 --> points to "pple"
str + 3 --> points to "le"
DATA SEGMENT
Address     Value
--------    ------
0xff0       'a'      <- str
0xff1       'p'
0xff2       'p'
0xff3       'l'
0xff4       'e'
0xff5       '\0'
Arrays of Pointers
Used to group multiple strings (e.g., argv in main(int argc, char *argv[])).
Pointer Arithmetic
Pointer arithmetic depends on the type of the pointer.
char *str = "apple";
char *str3 = str + 3;
printf("%s", str3); // Outputs "le"

int nums[] = {52, 23, 12, 34};
int *nums3 = nums + 3;
printf("%d", *nums3); // 34

str[2] == *(str + 2)
// Pointer Difference Gives Element Offset, Not Bytes
int diff = nums3 - nums; // 3, not bytes!
const Keyword
Use const to declare global constants in your program. This indicates the variable cannot change after being created.
Sometimes we use const with pointer parameters to indicate that the function will not / should not change what it points to. The actual pointer can be changed, however.
// This function promises to not change str’s characters
int countUppercase(const char *str) {
    int count = 0;
    for (int i = 0; i < strlen(str); i++) {
        if (isupper(str[i])) {
            count++;
        }
    }
    return count;
}
By definition, C gets upset when you set a non-const pointer equal to a const pointer. You need to be consistent with const to reflect what you cannot modify.
Structs
Basic Struct
struct date {
    int month;
    int day;
};
With typedef
typedef struct {
    int month;
    int day;
} date;

date today = {1, 28};
Passing Structs
- By value: copies the entire struct.
- By pointer: modifies the original.
Arrays of Structs
typedef struct {
    int x;
    char c;
} my_struct;

my_struct array_of_structs[5];
array_of_structs[0] = (my_struct){0, 'A'};
Ternary Operator
A shorthand conditional expression.
int x = (argc > 1) ? 50 : 0;
Memory Layout
- The stack is the place where all local variables and parameters live for each function. A function’s stack “frame” goes away when the function returns.
- The stack grows downwards when a new function is
called, and shrinks upwards when the function is
finished
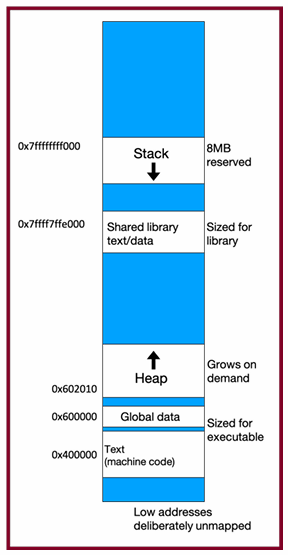
The Stack
- Used for function call frames, parameters, local variables
- LIFO (last-in-first-out): frames are pushed/popped on call/return
Interesting fact: C does not clear out memory when a function’s frame is removed. Instead, it just marks that memory as usable for the next function call. This is more efficient!
A stack overflow is when you use up all stack memory. E.g. a recursive call with too many function calls.
Heap Memory
We need a way to have memory that doesn’t get cleaned up when a function exits.
- Heap memory persists after function return
- You must manually free it
use malloc
void *malloc(size_t size);
void *means a pointer to generic memory. You can set another pointer equal to it without any casting.
Function Example
char *create_string(char ch, int n) {
  char *new_str = malloc((sizeof(char) * (n + 1));
  for (int i = 0; i < n; i++) {
    new_str[i] = ch;
  }
  new_str[n] = '\0';
  return new_str;
}
Memory Management Helpers
strdup
char *str = strdup("Hello");
// Allocates and copies string to heap
str[0] = 'h'; // OK
calloc
int *arr = calloc(5, sizeof(int)); // All elements zero-initialized
- malloc returns a pointer to a certain number of allocated bytes. It doesn’t
know or care whether it will be used as an array, a single block of memory, etc.
It just allocates and returns bytes for you. - If an allocation error occurs (e.g. out of heap memory!), malloc will return NULL. This is an important case to check, for robustness.
free() and Memory Leaks
Proper Memory Cleanup
char *bytes = malloc(4);
...
free(bytes); // Free once only!
Common Mistakes
Freeing same memory twice:
char *a = malloc(4);
char *b = a;
free(a);
free(b); // ERROR
Freeing offset address:
free(bytes + 1); // INVALID
realloc
Resizing Memory
char *str = strdup("Hello");
char *add = " world!";
str = realloc(str, strlen(str) + strlen(add) + 1);
strcat(str, add); // Now str = "Hello world!"
free(str);
- If successful, may move to a new location
- Old memory is automatically freed
- Only valid on pointers returned by malloc, calloc, strdup, realloc
Debugging Strategy
- Observe the bug
- Minimize input
- Narrow search space
- Use GDB and visualizations
- Experiment
- Fix and verify
Memory Leaks
- A memory leak occurs when you lose all references to heap-allocated memory.
- Doesn’t crash program—but consumes RAM.
- Tools like Valgrind can detect leaks.
- Don’t worry during prototyping; fix before submission.
Stack vs. Heap: Summary
| Feature | Stack | Heap |
|---|---|---|
| Lifetime | Automatic (function end) | Manual (malloc + free) |
| Speed | Fast | Slower |
| Size | Limited (~8MB) | Large (until system runs out) |
| Resizable? | No | Yes (realloc) |
| Safety | Compiler type-checks | You manage it |
Generics
Goal: To write C code that operates on any data type, reducing code duplication and improving reusability. Generic functions in C are used for various purposes like sorting, searching, and memory management.
The Need for Generic Swap
The lecture uses the example of a swap function to illustrate the need for generics.
Initially, type-specific swap functions are created (swap_int, swap_short, swap_string).
This leads to code duplication, as the logic for swapping is the same regardless of the data type.
void swap_int(int *a, int *b) {
    int temp = *a;
    *a = *b;
    *b = temp;
}

void swap_short(short *a, short *b) {
    short temp = *a;
    *a = *b;
    *b = temp;
}

void swap_string(char **a, char **b) {
    char *temp = *a;
    *a = *b;
    *b = temp;
}
Generic Swap Implementation
The solution is to use void * to create a generic swap function.
void * is a pointer to an unknown data type, allowing the function to accept pointers to any type.
The generic swap function takes the addresses of the data to be swapped and the size of the data in bytes as arguments.
void swap(void *data1ptr, void *data2ptr, size_t nbytes) {
    char temp[nbytes];
    memcpy(temp, data1ptr, nbytes);
    memcpy(data1ptr, data2ptr, nbytes);
    memcpy(data2ptr, temp, nbytes);
}
temp[nbytes] creates a temporary buffer to hold the data.
memcpy is used to copy the data between the addresses and the temporary buffer because we can’t dereference a void * directly.
memcpy and memmove
memcpy: Copies n bytes from src to dest. It assumes no overlap between the source and destination regions.
void *memcpy(void *dest, const void *src, size_t n);

int x = 5;
int y = 4;
memcpy(&x, &y, sizeof(x));  // x becomes 4
memmove: Similar to memcpy but handles overlapping regions correctly.
void *memmove(void *dest, const void *src, size_t n);
Generics Pitfalls
Type Casting: void * needs to be cast to a specific type before dereferencing
Swap Ends
void swap_ends(void *arr, size_t nelems, size_t elem_bytes) {
    swap(arr, (char *)arr + (nelems– 1) * elem_bytes, elem_bytes);
}
You’re asked to write a function that swaps the first and last elements in an array of numbers. Well, now it can swap for an array of anything!
Function Pointers
Void * Pitfalls
- void *s are powerful, but dangerous - C cannot do as much checking!
- E.g. with int, C would never let you swap half of an int. With void *s, this can happen!
int x = 0xffffffff;
int y = 0xeeeeeeee;
swap(&x, &y, sizeof(short));
// now x = 0xffffeeee, y = 0xeeeeffff!
printf("x = 0x%x, y = 0x%x\n", x, y);
Stack Structs
Each node can no longer store the data itself, because it could be any size!
Instead, it stores a pointer to the data somewhere else.
typedef struct node {
    struct node *next;
    void *data;
} node;

typedef struct stack {
    int nelems;
    int elem_size_bytes;
    node *top;
} stack;

stack *stack_create(int elem_size_bytes) {
    stack *s = malloc(sizeof(stack));
    s->nelems = 0;
    s->top = NULL;
    s->elem_size_bytes = elem_size_bytes;
    return s;
}

void stack_push(stack *s, const void *data) {
    node *new_node = malloc(sizeof(node));
    new_node->data = malloc(s->elem_size_bytes);
    memcpy(new_node->data, data, s->elem_size_bytes);
    new_node->next = s->top;
    s->top = new_node;
    s->nelems++;
}

void stack_pop(stack *s, void *addr) {
    if (s->nelems == 0) {
        error(1, 0, "Cannot pop from empty stack");
    }
    node *n = s->top;
    memcpy(addr, n->data, s->elem_size_bytes);
    s->top = n->next;
    free(n->data);
    free(n);
    s->nelems--;
}
Function Pointers
Definition: A function pointer is a variable that stores the address of a function. This allows functions to be passed as arguments to other functions.
Syntax: The syntax for declaring a function pointer includes the return type and parameter types of the function it can point to.
return_type (*function_pointer_name)(parameter_types);
Generic Bubble Sort
// Comparison function for integers
int int_compare(const void *a, const void *b) {
    return *(int*)a - *(int*)b;
}

void bubble_sort(void *arr, int n, int elem_size_bytes, int (*compare_fn)(const void *, const void *)) {
    for (int i = 0; i < n - 1; i++) {
        for (int j = 0; j < n - i - 1; j++) {
            void *a = (char *)arr + j * elem_size_bytes;
            void *b = (char *)arr + (j + 1) * elem_size_bytes;
            if (compare_fn(a, b) > 0) {
                // Swap elements
                char temp[elem_size_bytes];
                memcpy(temp, a, elem_size_bytes);
                memcpy(a, b, elem_size_bytes);
                memcpy(b, temp, elem_size_bytes);
            }
        }
    }
}

int main() {
    int nums[] = {5, 2, 9, 1, 5, 6};
    int n = sizeof(nums) / sizeof(nums[0]);
    bubble_sort(nums, n, sizeof(int), int_compare);
    for (int i = 0; i < n; i++) {
        printf("%d ", nums[i]);  // Output: 1 2 5 5 6 9
    }
    printf("\n");
    return 0;
}
Generic C Standard Library Functions
- qsort– I can sort an array of any type! To do that, I need you to provide me a function that can compare two elements of the kind you are asking me to sort.
- bsearch– I can use binary search to search for a key in an array of any type! To do that, I need you to provide me a function that can compare two elements of the kind you are asking me to search.
- lfind– I can use linear search to search for a key in an array of any type! To do that, I need you to provide me a function that can compare two elements of the kind you are asking me to search.
- lsearch- I can use linear search to search for a key in an array of any type! I will also add the key for you if I can’t find it. In order to do that, I need you to provide me a function that can compare two elements of the kind you are asking me to search.
- scandir– I can create a directory listing with any order and contents! To do that, I need you to provide me a function that tells me whether or not you want me to include a given directory entry in the listing. I also need you to provide me a function that tells me the correct ordering of two given directory entries.
Floating Point
- Fixed Point Representation: A method to represent real numbers by adding binary decimal places. It has limitations in the range of numbers it can represent.
- Floating Point Representation: A more flexible method to represent a wider range of real numbers, similar to scientific notation.
- IEEE Floating Point Standard: The most common standard for representing floating-point numbers.
- Floating Point Imprecision: Floating point numbers may introduce approximation and rounding errors.
- Floating Point Arithmetic: Arithmetic operations on floating point numbers can have unexpected behavior due to precision limits (e.g., non-associativity).
#include <stdio.h>

int main() {
    float a = 0.1;
    float b = 0.2;
    if (a + b == 0.3) {
        printf("Equal\n");
    } else {
        printf("Not Equal\n"); // This will print
    }
    printf("%.20f\n", a + b); // Output: 0.30000000000000004
    return 0;
}
Conceptual - actual IEEE representation is more complex
   Sign  | Exponent | Mantissa
   1 bit |  8 bits  | 23 bits
Floating Point in C
- C Guarantees Two Levels– float single precision– double double precision
- Conversions/Casting– Casting between int, float, and double changes bit representation– double/float → int
- Truncates fractional part
- Like rounding toward zero
- Not defined when out of range or NaN: Generally sets to TMin
- int → double
- Exact conversion, as long as int has ≤ 53 bit word size
- int → float
- Will round according to rounding mode
Reading
What Every Computer Scientist Should Know About Floating-Point Arithmetic
IEEE-754 Floating Point Converter
About numbers, and how to get subtraction wrong
Fast Inverse Square Root — A Quake III Algorithm
Introduction to Assembly
Overview
Goals:
- Understand what assembly is and why it matters.
- Learn about the x86-64 architecture and its syntax.
- Introduce
movinstructions and how data is moved at the assembly level.
1. What is Assembly?
Definition:
Assembly is a human-readable representation of machine code.
- Compilers like GCC convert C code into assembly.
- Each line of C may generate multiple assembly instructions.
- Assembly is machine-specific (e.g., x86-64, ARM, MIPS).
C → Assembly Example:
int sum = x + y;
Assembly Abstraction:
1) Copy x into register R1
2) Copy y into register R2
3) Add R2 to R1
4) Store result from R1 to sum
2. Registers
Definition:
Registers are 64-bit storage locations inside the CPU used for fast temporary storage and operations.
Common Registers:
%rax, %rbx, %rcx, %rdx,
%rsi, %rdi, %rbp, %rsp,
%r8 to %r15
Usage:
- Store intermediate values
- Pass function arguments
- Hold return values
3. Viewing Assembly
Use objdump -d <program> to inspect the assembly code of a compiled program.
4. Our First Assembly: sum_array
C Code:
int sum_array(int arr[], int nelems) {
    int sum = 0;
    for (int i = 0; i < nelems; i++) {
        sum += arr[i];
    }
    return sum;
}
Disassembled Assembly:
4005b6: ba 00 00 00 00     mov $0x0,%edx        ; i = 0
4005bb: b8 00 00 00 00     mov $0x0,%eax        ; sum = 0
4005c0: eb 09              jmp 4005cb           ; jump to condition
4005c2: 48 63 ca           movslq %edx,%rcx     ; rcx = (long) edx
4005c5: 03 04 8f           add (%rdi,%rcx,4),%eax ; sum += arr[i]
4005c8: 83 c2 01           add $0x1,%edx        ; i++
4005cb: 39 f2              cmp %esi,%edx        ; compare i < nelems
4005cd: 7c f3              jl 4005c2            ; loop
4005cf: f3 c3              repz retq            ; return
Key:
%rdi:arr%esi:nelems%eax: return value / sum%edx: loop index
5. Assembly Instruction Format
Each instruction has:
- Opcode (operation): e.g.,
mov,add,cmp - Operands (data): e.g., registers, memory, constants
6. mov Instruction
mov src, dst
- Moves bytes from
srctodst - Only one memory operand allowed
7. Operand Types
Immediate:
mov $0x42, %rax
Moves constant value 0x42 into %rax.
Register:
mov %rbx, %rax
Copies contents of %rbx into %rax.
Absolute Address:
mov 0x104, %rax
Copies value at memory address 0x104 into %rax.
Indirect:
mov (%rbx), %rax
Copies value at the memory address stored in %rbx into %rax.
Base + Displacement:
mov 0x10(%rax), %rbx
Loads from memory address 0x10 + %rax.
Indexed:
mov (%rax,%rdx), %rcx
Loads from address (%rax + %rdx).
Indexed + Displacement:
mov 0x10(%rax,%rdx), %rcx
Loads from 0x10 + %rax + %rdx.
Scaled Indexed:
mov (,%rdx,4), %rax
Loads from 4 * %rdx.
mov 0x4(,%rdx,4), %rax
Loads from 0x4 + 4 * %rdx.
Scaled Indexed with Base:
mov (%rax,%rdx,2), %rcx
Loads from %rax + 2 * %rdx.
mov 0x4(%rax,%rdx,2), %rcx
Loads from 0x4 + %rax + 2 * %rdx.
General Address Form:
Imm(%rb, %ri, scale)
=> Address = Imm + R[%rb] + R[%ri] * scale
8. Practice Questions from Slides
Example Setup:
Assume:
- Memory at
0x42=5 %rbx=8%rax=0x100%rdx=3- Memory at
0x10C=0x11
Examples:
mov $0x42, %rax        ; rax = 0x42
mov 0x42, %rax         ; rax = 5 (from memory)
mov %rbx, 0x55         ; memory[0x55] = 8
mov 4(%rax), %rcx      ; rcx = memory[0x104] = 0xAB
mov 9(%rax,%rdx), %rcx ; rcx = memory[0x100 + 3 + 9] = ?
9. Summary
Key Points:
- GCC turns C code into x86-64 assembly.
- Assembly uses registers and memory addresses directly.
movis the fundamental instruction to move data.- Assembly instructions work on bytes, not types.
- Understanding operand forms is critical for reading assembly.
readings
An Introduction to 64-bit Computing and x86-64
The story of Mel (Annotated version)
Arithmetic, Logic, and Condition Codes
1. Recap: What is Assembly?
- Assembly is a low-level, human-readable language that closely reflects the binary machine code executed by the CPU.
- Operates on registers—64-bit “scratchpad” storage inside the processor.
- Assembly instructions correspond to operations on data inside registers or memory.
2. Data Sizes and Register Sizes
Terminology:
| Size Name | Bytes | Suffix |
|---|---|---|
| Byte | 1 | b |
| Word | 2 | w |
| Double | 4 | l |
| Quad | 8 | q |
Register Naming by Size (example with %rax):
| Size | Register |
|---|---|
| 64-bit | %rax |
| 32-bit | %eax |
| 16-bit | %ax |
| 8-bit | %al |
3. Register Responsibilities
%rax– Return value%rdi– First argument%rsi– Second argument%rdx– Third argument%rsp– Stack pointer (top of stack)%rip– Instruction pointer
4. mov Variants and Data Transfers
Suffixes:
movb,movw,movl,movq
Special Instructions:
movabsq $0x1122334455667788, %rax
- Use
movabsqto load a full 64-bit immediate constant into a register.
5. Zero and Sign Extension
movz (zero-extend)
| Instruction | Effect |
|---|---|
movzbw | byte → word |
movzbl | byte → double |
movzwq | word → quad |
movs (sign-extend)
| Instruction | Effect |
|---|---|
movsbw | byte → word |
movsbl | byte → double |
movslq | double → quad |
cltq ; Sign-extend %eax into %rax
6. lea: Load Effective Address
lea 6(%rax), %rdx
- Not a memory access — computes the address expression and places the result into the destination.
- Useful for address arithmetic.
lea vs mov Comparison:
| Expression | mov Meaning | lea Meaning |
|---|---|---|
6(%rax), %rdx | Read from memory at address | Compute 6 + %rax |
(%rax,%rcx),%rdx | Read from address %rax + %rcx | Compute %rax + %rcx |
(%rax,%rcx,4) | Read from %rax + 4 * %rcx | Compute %rax + 4 * %rcx |
7(%rax,%rax,8) | Read from 7 + %rax + 8 * %rax | Compute 7 + %rax + 8 * %rax |
7. Unary Arithmetic Instructions
incq 16(%rax)
dec %rdx
neg %rax
not %rcx
| Instruction | Description |
|---|---|
inc | Increment |
dec | Decrement |
neg | Negate (2’s complement) |
not | Bitwise NOT |
8. Binary Arithmetic and Logic
addq %rcx, (%rax)
xorq $16, (%rax, %rdx, 8)
subq %rdx, 8(%rax)
| Instruction | Effect |
|---|---|
add | D ← D + S |
sub | D ← D - S |
imul | D ← D * S |
xor | D ← D ^ S |
or | `D ← D |
and | D ← D & S |
9. Multiplication and Division
64-bit x 64-bit = 128-bit product:
- Result split across
%rdx:%rax.
imulq %rbx        ; Signed multiply: %rax × %rbx → %rdx:%rax
mulq  %rbx        ; Unsigned multiply
10. Division and Remainder
Usage:
%rdx:%raxis the dividend- Operand is the divisor
%raxgets the quotient%rdxgets the remainder
cqto            ; Sign-extend %rax into %rdx
idivq %rdi      ; Signed divide
divq  %rdi      ; Unsigned divide
11. Bit Shifts
shll $3, (%rax)           ; logical left shift
shr %cl, (%rax,%rdx,8)    ; logical right shift
sar $4, 8(%rax)           ; arithmetic right shift
| Instruction | Meaning |
|---|---|
sal / shl | Left shift |
shr | Logical right shift (zero-fill) |
sar | Arithmetic right shift (sign-extend) |
- Shift amount can be an immediate or stored in
%cl.
Note on %cl as Shift Amount:
%cl = 0xFFshlbuses only the lowest 3 bits → shift by 7shlwuses 4 bits → shift by 15- Higher-width shifts use more bits.
12. Code Examples from Lecture
C Code:
int add_to_first(int x, int arr[]) {
    int sum = x;
    sum += arr[0];
    return sum;
}
Division Example:
long full_divide(long x, long y, long *remainder_ptr) {
    long quotient = x / y;
    long remainder = x % y;
    *remainder_ptr = remainder;
    return quotient;
}
Summary
This lecture focuses on control flow in assembly language. It builds upon previous knowledge of data movement, arithmetic, and logical operations to explain how assembly handles conditional execution (if/else) and loops (while, for). Key to this is the concept of “condition codes,” which are special registers that store the results of operations and are used by conditional jump instructions. The lecture also covers specific assembly instructions related to comparisons, setting bytes based on conditions, conditional moves, and jumps.
1. Recap: Arithmetic and Logic
- Some registers have special roles:
%rax: return value%rdi,%rsi,%rdx: function parameters 1-3%rip: next instruction address%rsp: stack top address
movinstruction variants (movb,movw,movl,movq) move data of different sizes.movlto a register also zeroes out the upper 4 bytes.leainstruction copies the address of the source, not the data at the address.nop(no-op) instruction does nothing; used for alignment.mov %ebx, %ebxzeroes out the top 32 bits of %rbx.xor %ebx, %ebxalso sets %ebx to zero (and may be more efficient).
2. Control Flow
- C uses
if,else,while,forfor control flow. - Assembly uses condition codes and conditional jumps to achieve this.
3. Condition Codes
- CPU has single-bit condition code registers.
- Common condition codes:
- CF (Carry Flag): Carry-out from most significant bit (unsigned overflow).
- ZF (Zero Flag): Result is zero.
- SF (Sign Flag): Result is negative.
- OF (Overflow Flag): Two’s-complement overflow.
- Arithmetic/logic instructions update condition codes.
leadoes not. Logical operations set CF and OF to 0. Shift operations set CF to the last bit shifted out and OF to 0.incanddecaffect OF and ZF but not CF. cmpandtestinstructions only set condition codes (don’t store results).cmpis like subtraction,testis like AND.CMP S1, S2: CalculatesS2 - S1and sets flags.TEST S1, S2: CalculatesS2 & S1and sets flags.
4. Assembly Instructions for Control Flow
- Setting Bytes Conditionally:
setinstructions set a byte to 0 or 1 based on condition codes.sete D/setz D: Set if equal / zero (ZF = 1)setne D/setnz D: Set if not equal / not zero (ZF = 0)sets D: Set if negative (SF = 1)setns D: Set if non-negative (SF = 0)setg D/setnle D: Set if greater (signed >) (SF = 0 and SF = OF)- (and others for >=, <, <=, unsigned >, >=, <, <=)
- Conditionally Moving Data:
cmovinstructions conditionally move data.cmove S, R/cmovz S, R: Move if equal / zero (ZF = 1)cmovne S, R/cmovnz S, R: Move if not equal / not zero (ZF = 0)cmovs S, R: Move if negative (SF = 1)- (and others corresponding to
setconditions)
- Jump Instructions:
jmpjumps to another instruction.jmp Label: Direct jump (target is in the instruction)jmp 404f8 <loop+0xb>
jmp *Operand: Indirect jump (target address is in a register/memory)jmp *%rax
- Conditional jumps (
je,jne,js,jns,jg, etc.) jump only if a condition is true.je Label/jz Label: Jump if equal / zero (ZF = 1)jne Label/jnz Label: Jump if not equal / not zero (ZF = 0)- (and others corresponding to
setconditions)
5. Implementing Control Flow
- If/Else:
- Assembly: Calculate condition, jump past
ifbody if false, jump pastelseafterifbody. - Example C:
if (num > 3) { x = 10; } else { x = 7; } num++; - Assembly structure:
; Test (num > 3)
; Jump past if-body if test fails
; If-body (x = 10)
; Jump past else-body
; Else-body (x = 7)
; Past else body
; num++;
- Assembly: Calculate condition, jump past
- While Loop:
- Assembly: Jump to the test, execute the body, test again, jump back to the body if the test succeeds.
- Example C:
void loop() { int i = 0; while (i < 100) { i++; } } - Assembly:
0x0000000000400570 <+0>:    mov    $0x0,%eax       ; i = 0
0x0000000000400575 <+5>:    jmp    0x40057a <loop+10> ; Jump to test
0x0000000000400577 <+7>:    add    $0x1,%eax       ; i++
0x000000000040057a <+10>:   cmp    $0x63,%eax       ; i < 99?
0x000000000040057d <+13>:   jle    0x400577 <loop+7> ; Jump if i <= 99
0x000000000040057f <+15>:   repz retq
- For Loop:
- Assembly: Similar to
while, but initialization and update are also included. Compiler optimizations can change the exact structure. - C Equivalent While Loop
for (init; test; update) { body } init; while (test) { body update } - For Loop Assembly
Init Jump to test Body Update Test Jump to body if success - GCC For Loop Output
Initialization
Test
Jump past loop if fails
Body
Update
Jump to test
- Assembly: Similar to
6. Optimizations
- Conditional moves can avoid jumps, which can be slow due to branch prediction.
Summary
Lecture 14 delves into how function calls are implemented in assembly language. It explains the crucial role of the stack in managing function calls, including parameter passing, local variable storage, and return addresses. The lecture also covers the mechanics of the %rip register (instruction pointer) and how it’s affected by function calls and returns. Key instructions like push, pop, callq, and retq are discussed in detail. The concept of register saving and restoring is introduced to ensure proper function execution.
1. Recap: Control Flow
- C control flow statements (if/else, while, for) are implemented in assembly using condition codes and conditional jumps.
- Condition codes (CF, ZF, SF, OF) store results of arithmetic/logic operations.
setinstructions, conditionalmovinstructions, and conditionaljmpinstructions use condition codes.jmpinstruction:jmp Label: Direct jump.jmp *Operand: Indirect jump.
2. The Instruction Pointer (%rip)
%ripregister stores the address of the currently executing instruction.- Instructions are just bytes in memory.
- Hardware increments
%ripto the next instruction. jmpinstructions modify%ripto change the flow of execution.- Relative jumps use offsets (e.g.,
jmp 0x40057a).
3. Calling Functions
- Calling a function involves:
- Passing control to the callee and resuming caller execution later.
- Passing data (parameters, return values).
- Managing memory (stack).
4. The Stack
%rspregister stores the address of the top of the stack.- Stack grows downwards in memory.
- Stack frames are used to store function data.
%rspmust be the same before and after a function call.push S:- Decrements
%rspby 8. - Stores the value of S at the new top of the stack.
- Decrements
pushq Sis equivalent tosubq $8, %rsp; movq S, (%rsp).pop D:- Reads the value from the top of the stack.
- Stores it in D.
- Increments
%rspby 8.
popq Dis equivalent tomovq (%rsp), D; addq $8, %rsp.
5. Passing Control
callq Label:- Pushes the return address (address of the next instruction in the caller) onto the stack.
- Jumps to the callee’s code (modifies
%rip).
retq:- Pops the return address from the stack.
- Jumps to the return address (modifies
%rip).
6. Passing Data
- Registers are used to pass parameters.
%rdi: 1st parameter%rsi: 2nd parameter%rdx: 3rd parameter%rcx: 4th parameter%r8: 5th parameter%r9: 6th parameter%raxis used to return the return value.
7. Local Storage
- The stack is used for local variables that don’t fit in registers.
- Callees can push data onto the stack.
8. Register Restrictions
- Callee-saved registers:
%rbp,%rbx,%r12-%r15Callees must preserve their original values. - If a callee modifies a callee-saved register, it must:
- Push the original value onto the stack before modifying it.
- Pop the original value from the stack before returning.
- Caller-saved registers: All other registers. The caller must save these if it wants to preserve their values across function calls.
Summary
Lecture 15 covers heap allocators, explaining their role in managing dynamic memory allocation via malloc, realloc, and free. It discusses the requirements and goals of heap allocators, including handling allocation/free sequences, tracking memory usage, and optimizing for throughput and memory utilization. The lecture then details three heap allocator implementation methods: Bump Allocator (focused on speed), Implicit Free List Allocator (using headers to track free/allocated blocks), and Explicit Free List Allocator (more efficient free block management). Finally, it briefly touches on compiler optimizations.
1. The Heap and Heap Allocators
- The heap is a memory area that grows upwards, used for dynamic memory allocation.
- Heap memory persists until explicitly freed, unlike stack memory.
- A heap allocator manages heap memory by fulfilling allocation requests.
- It receives a large memory block and divides it into smaller blocks for allocation.
- Key functions:
malloc(size_t size): Allocates a block of at leastsizebytes.free(void *ptr): Frees the allocated block atptr.realloc(void *ptr, size_t size): Resizes the allocated block atptr.
2. Heap Allocator Requirements
- Handle any sequence of allocate and free requests.
- Track allocated and free memory regions.
- Choose which free memory to use for allocation.
- Respond to allocation requests immediately.
- Return 8-byte aligned memory addresses.
3. Heap Allocator Goals
- Maximize throughput (requests served per unit time).
- Maximize memory utilization (efficient use of heap memory).
- Fragmentation reduces utilization (unused memory that can’t fulfill requests).
- Relocating allocated blocks is not allowed as it invalidates pointers.
- Throughput and utilization can be conflicting goals.
4. Bump Allocator
- A simple allocator that allocates the next available memory.
- Free operations are no-ops.
- High throughput, very poor utilization (no memory reuse).
- Example:
malloc(4)allocates 4 bytes.free()does nothing.
- Illustrates the throughput vs. utilization trade-off.
5. Implicit Free List Allocator
- Tracks allocated/free blocks using headers before each block.
- Header stores block size and allocation status.
mallocsearches for a free block and updates the header.freeupdates the block’s header to mark it as free.- Improves utilization over Bump Allocator by reusing freed memory.
6. Explicit Free List Allocator
- Uses a separate data structure (e.g., linked list) to track free blocks, improving efficiency of free block management.
7. Optimization
- (Briefly mentioned)
- Compiler optimizations can improve code efficiency.
Optimization
This lecture, CS107 Lecture 16, focuses on program optimization, aiming to help students understand how to improve code efficiency and speed and learn about the optimizations that the GCC compiler can perform.
What is Optimization?
Optimization is the process of making a program faster or more efficient in terms of time and space. While understanding Big-O notation provides a foundation for efficiency, targeted optimizations can lead to significant performance gains. However, it’s important to focus optimization efforts where they are most needed.
A general approach to optimization is summarized as follows:
- If doing something seldom and only on small inputs, do whatever is simplest to code, understand, and debug.
- If doing things thing a lot, or on big inputs, make the primary algorithm’s Big-O cost reasonable.
- Let gcc do its magic from there.
- Optimize explicitly as a last resort.
GCC Optimization
The GCC compiler can perform various optimizations at different levels. The lecture compares two levels:
gcc -O0: Primarily a literal translation of C code.gcc -O2: Enables nearly all reasonable optimizations.
Other, more aggressive or specialized optimization levels exist, such as -O3 (more aggressive, potentially trades size for speed), -Os (optimizes for size), and -Ofast (disregards standards compliance for maximum speed). A comprehensive list of GCC optimization flags is available in the GCC documentation.
Optimizations performed by GCC can target one or more of the following:
- Static instruction count
- Dynamic instruction count
- Cycle count / execution time
Here are some specific GCC optimizations discussed:
Constant Folding
Constant folding is the process where the compiler pre-calculates constant expressions at compile-time.
Example C code:
int seconds = 60 * 60 * 24 * n_days;
The constant expression 60 * 60 * 24 can be calculated by the compiler, so the compiled code will directly use the result (86400) instead of performing the multiplications at runtime.
Example with a more complex expression:
int fold(int param) {
  char arr[5];
  int a = 0x107;
  int b = a * sizeof(arr);
  int c = sqrt(2.0);
  return a * param + (a + 0x15/c + strlen("Hello") * b - 0x37) / 4;
}
Before optimization (-O0), the assembly shows multiple instructions for calculating the expression:
0000000000400626 <fold>:
400626: 55                   push   %rbp
400627: 53                   push   %rbx
400628: 48 83 ec 08          sub    $0x8,%rsp
40062c: 89 fd                mov    %edi,%ebp
40062e: f2 0f 10 05 da 00 00 movsd  0xda(%rip),%xmm0        # 400710 <_IO_stdin_used+0x10>
400635: 00
400636: e8 d5 fe ff ff       callq  400510 <sqrt@plt>
40063b: f2 0f 2c c8          cvttsd2si %xmm0,%ecx
40063f: 69 ed 07 01 00 00    imul   $0x107,%ebp,%ebp
400645: b8 15 00 00 00       mov    $0x15,%eax
40064a: 99                   cltd
40064b: f7 f9                idiv   %ecx
40064d: 8d 98 07 01 00 00    lea    0x107(%rax),%ebx
400653: bf 04 07 40 00       mov    $0x400704,%edi          # "Hello"
400658: e8 93 fe ff ff       callq  4004f0 <strlen@plt>
40065d: 48 69 c0 23 05 00 00 imul   $0x523,%rax,%rax
400664: 48 63 db             movslq %ebx,%rbx
400667: 48 8d 44 18 c9       lea    -0x37(%rax,%rbx,1),%rax
40066c: 48 c1 e8 02          shr    $0x2,%rax
400670: 01 e8                add    %ebp,%eax
400672: 48 83 c4 08          add    $0x8,%rsp
400676: 5b                   pop    %rbx
400677: 5d                   pop    %rbp
400678: c3                   retq
After optimization (-O2), the assembly is significantly shorter, indicating many parts of the expression were folded into constants:
00000000004004f0 <fold>:
4004f0: 69 c7 07 01 00 00    imul   $0x107,%edi,%eax
4004f6: 05 a5 06 00 00       add    $0x6a5,%eax
4004fb: c3                   retq
4004fc: 0f 1f 40 00          nopl   0x0(%rax)
Common Sub-expression Elimination
This optimization prevents recalculating the same expression multiple times by computing it once and storing the result.
Example C code:
int a = (param2 + 0x107);
int b = param1 * (param2 + 0x107) + a;
return a * (param2 + 0x107) + b * (param2 + 0x107);
The expression (param2 + 0x107) is a common sub-expression. GCC will calculate it once and reuse the result. The assembly shows the optimization taking place. This optimization can even occur at -O0.
00000000004004f0 <subexp>:
4004f0: 81 c6 07 01 00 00    add    $0x107,%esi
4004f6: 0f af fe             imul   %esi,%edi
4004f9: 8d 04 77             lea    (%rdi,%rsi,2),%eax
4004fc: 0f af c6             imul   %esi,%eax
4004ff: c3                   retq
Dead Code Elimination
Dead code elimination removes code that has no effect on the program’s output.
Examples of dead code:
- An
ifstatement with a condition that is always false:if (param1 < param2 && param1 > param2) - An empty
forloop:for (int i = 0; i < 1000; i++); if/elsestatements where both branches perform the same operation.if/elsestatements where theelsebranch is effectively unreachable or redundant.
Before optimization (-O0), the assembly includes instructions for the dead code:
00000000004004d6 <dead_code>:
4004d6: b8 00 00 00 00       mov    $0x0,%eax
4004db: eb 03                jmp    4004e0 <dead_code+0xa>
4004dd: 83 c0 01             add    $0x1,%eax
4004e0: 3d e7 03 00 00       cmp    $0x3e7,%eax
4004e5: 7e f6                jle    4004dd <dead_code+0x7>
4004e7: 39 f7                cmp    %esi,%edi
4004e9: 75 05                jne    4004f0 <dead_code+0x1a>
4004eb: 8d 47 01             lea    0x1(%rdi),%eax
4004ee: eb 03                jmp    4004f3 <dead_code+0x1d>
4004f0: 8d 47 01             lea    0x1(%rdi),%eax
4004f3: f3 c3                repz retq
After optimization (-O2), the dead code is removed in the assembly:
00000000004004f0 <dead_code>:
4004f0: 8d 47 01             lea    0x1(%rdi),%eax
4004f3: c3                   retq
4004f4: 66 2e 0f 1f 84 00 00 nopw %cs:0x0(%rax,%rax,1)
4004fb: 00 00 00
4004fe: 66 90                xchg   %ax,%ax
Strength Reduction
Strength reduction replaces computationally expensive operations with equivalent, less expensive ones. Examples include changing division to multiplication (by the reciprocal), or multiplication and modulo operations to bit shifts and bitwise AND when dealing with powers of two.
Example C code:
int a = param2 * 32; // multiplication can be replaced by left shift
int b = a * 7;
int c = b / 3;
int d = param2 % 2; // modulo by 2 can be replaced by bitwise AND with 1
for (int i = 0; i <= param2; i++) {
  c += param1[i] + 0x107 * i; // multiplication in loop might be optimized
}
return c + d;
Code Motion
Code motion moves computations out of loops if their results do not change during the loop iterations.
Example C code:
for (int i = 0; i < n; i++) {
  sum += arr[i] + foo * (bar + 3);
}
The expression foo * (bar + 3) can be calculated once before the loop starts, as its value does not depend on the loop variable i.
Tail Recursion
GCC can sometimes optimize tail-recursive functions by converting them into iterative loops, avoiding the overhead of recursive function calls.
Example C code:
long factorial(int n) {
  if (n <= 1) return 1;
  else return n * factorial(n - 1); // This is not tail recursion
}
A tail-recursive version would have the recursive call as the very last operation in the function.
Loop Unrolling
Loop unrolling reduces loop overhead by performing multiple iterations of the loop body within a single iteration of the compiled loop.
Example C code:
for (int i = 0; i <= n - 4; i += 4) {
  sum += arr[i];
  sum += arr[i + 1];
  sum += arr[i + 2];
  sum += arr[i + 3];
} // after the loop handle any leftovers
This manually unrolled loop processes 4 elements in each iteration, reducing the number of loop condition checks and jumps. Compilers can often perform this optimization automatically.
Limitations of GCC Optimization
While powerful, GCC cannot optimize everything because it doesn’t have the same level of understanding of the code’s intent as the programmer.
Example:
int char_sum(char *s) {
  int sum = 0;
  for (size_t i = 0; i < strlen(s); i++) { // Bottleneck: strlen called in each iteration
    sum += s[i];
  }
  return sum;
}
The bottleneck here is calling strlen(s) in every loop iteration. A programmer knows that the length of the string s does not change within the loop, and can manually optimize this by calculating the length once before the loop. While GCC might apply code motion to move strlen out of the loop in some cases, it cannot always guarantee this due to potential side effects or aliasing.
Another example:
void lower1(char *s) {
  for (size_t i = 0; i < strlen(s); i++) { // Bottleneck: strlen called in each iteration
    if (s[i] >= 'A' && s[i] <= 'Z') {
      s[i] -= ('A' - 'a');
    }
  }
}
Again, strlen(s) is called repeatedly. GCC cannot move strlen out of this loop because the string s is being modified within the loop. Although the modification doesn’t change the string’s length, GCC cannot assume this. A programmer, knowing this, can manually optimize by calculating the length once before the loop.
Caching
Program performance is not solely limited by processor speed; memory access can be a significant bottleneck. Computer systems use a hierarchy of memory levels, ranging from very fast (registers) to very slow (disk). Data that is used more frequently is moved to faster memory levels.
Caching relies on locality:
- Temporal locality: Data that has been accessed recently is likely to be accessed again soon (co-located in time).
- Spatial locality: Data located near recently accessed data is also likely to be accessed (co-located in space).
A high cache hit rate is crucial for performance. Even a small percentage of cache misses can significantly impact the total memory access time.
Resources
Here are useful materials and references about the tools and topics covered in CS107.
The Emacs Editor
Click here for a walkthrough video.
Click here for an Emacs reference card.
emacs is the command-line text editor used in CS107 to work on projects. It is a text editor that was modified by Richard Stallman (also see Richard Stallman on Wikipedia, who has an interesting outlook on life. This guide can get you up and running with emacs!
Getting Started
Before you start using emacs, you’ll want to configure it to use the CS107 default preferences; this sets up the editor to do things like use mouse controls, display line numbers, standardize indentation, etc. To do this, execute the following command after logging into myth:
wget https://cs107.stanford.edu/resources/sample_emacs -O ~/.emacs
emacs looks for a special .emacs file on your system to know what preferences you would like, and this command downloads our pre-made .emacs file and puts it on your system. If you don’t do this, you won’t be able to use some of the shortcuts and commands highlighted in lecture and the guides.
Bonus: Custom Themes
If you’re interested, you can further customize the default color theme. If you don’t like the theme chosen in our configuration, open any file in emacs, and then type M-x customize-themes (M means the “Meta” key, which is discussed later on). This will take you to a page where you can choose your own theme. Once there, pick a theme by moving your cursor onto a theme and hitting ENTER. Finally, move your cursor to Save Theme Settings and hit ENTER to save. Open a new file in emacs to see what the theme looks like.
Overview
Emacs works similarly to other editors you might have used; it lets you enter and edit text, and has certain keyboard shortcuts to perform common commands. The two keys it uses for these shortcuts are Control and Meta (which is Alt, or Option on a Mac).
Before continuing: if you’re using a Mac, or a Windows computer with SecureCRT, make sure you have followed the instructions to configure your Meta key, as described in the logging-in guide. This will ensure that your Meta key is properly set to be Option (Mac) or Alt (Windows). Otherwise, some of the keyboard shortcuts below will not work!
Opening emacs
To open a file in emacs (or create a new one if a file with this name does not exist):
$ emacs filename
If emacs is already open and you would like to edit a different file, use the Ctl-x Ctl-f command. Again, if this file exists in your current directory it will open it, or it will create it if it does not already exist in your current directory.
You can open multiple files in emacs side-by-side (e.g. to copy-paste between them) by specifying multiple filenames when you open emacs:
emacs file1.c file2.c
Saving and Quitting emacs
Ctl-x Ctl-s save the current changes to a file. Ctl-x Ctl-w lets you save the file under a different name (like “Save As” in graphical editors).
Ctl-x Ctl-c quits Emacs. If you have unsaved changes, you will be asked whether or not you’d like to save your changes before quitting.
Navigating A File
You can use the mouse to navigate a file as you might expect in other graphical text editors. Specifically, you can click to position the cursor, and use the mouse to scroll through the file. You can also use the arrow keys to navigate the file if you would prefer.
There are also several additional keyboard shortcuts to navigate within a file:
Meta-f or Meta-right arrow move to the next word
Meta-b or Meta-back arrow move to the previous word
Ctl-a or Meta-a move to the beginning of the line
Ctl-e or Meta-e move to the end of the line
Meta-g g [NUMBER] jump to a line number. For example, typing Meta-g g 123 would jump to line 123.
Ctl-v page down
Meta-v page up
Meta-< (less-than sign) jump to the start of the file
Meta-> (greater-than sign) jump to the end of the file
Searching
Search is another great way to move your cursor.
Ctl-s searches the file, and prompts you to enter text to search for.
Ctl-s move the cursor to the next search match
Ctl-r move the cursor to the previous search match
Meta-% find and replace text ahead of the current cursor position
Editing Text
You can type as normal to insert or delete text wherever the cursor is in the document. There are also additional shortcuts below for cut/copy/paste and selecting/deleting text:
Click and drag with the mouse to highlight text. (Note: the highlighting text feature will not highlight the text you have chosen until after you have released the mouse).
Ctl-SPACE to put a marker down, and move the cursor to select text
Ctl-w to cut (“kill”) the current selection Meta-w to copy the current selection Ctl-y to paste (“yank”) whatever is in the copy-paste buffer
Ctl-k cut (“kill”) the text on the current line to the right of the cursor
If you hit Ctl-k multiple times in a row (with no other commands between), all the lines will be passed when you hit Ctl-y.
Ctl-d to delete the character under the cursor. Backspace to delete the character before the cursor.
Undo/Redo
Ctl-x u undo the last action
Ctl-g cancel (if you’re stuck in a command or prompt, pressing this, sometimes several times, should get you out)
More Resources
The best way to get familiar with emacs is to just start using it to edit files - type something, anything! Over time, you’ll become more comfortable with the standard commands, and pick up more advanced ones. If you are looking for more references for how to use emacs, check out the following additional resources:
Ctl-his a command withinemacsthat opens the help menu where you can search for help for different commands.- Emacs Commands Reference Card
- Section 4 of this Stanford Unix Programming Tools document.
- Stanford Farmshare guide to emacs
Frequently Asked Questions
Do I have to use emacs? Can I use another text editor?
While there are a variety of text editors available, both command-line editors and GUI editors, emacs is the editor we choose to work on projects in CS107. It works similarly to other text editors you might have already used, and because you are always editing your files on the myth machines via ssh, it means that there is less risk of you losing your work. It is also easy to learn other editors that you may be interested in once you learn emacs.
While we won’t prevent you from using a different editor if you do not want to use emacs, note that we only officially support using emacs in CS107 and can’t answer questions about other editors or configurations. In particular, we do not recommend using a local editor such as Sublime Text to edit remote files. This is because of risks associated with missed updates, weird synchronization issues, dangerous data loss, and more, which we have seen cause students to lose work. Additionally, learning a Unix-based editor is an essential skill, as a local editor setup may not always be available or appropriate.
Compiling Programs with Make
Click here for a walkthrough video.
In CS107, we will use a program called make to compile our programs. Make is a program that dates back to 1976, and it is used to build projects with dependencies such that it only recompiles files that have been changed, and avoids having to type lengthy compile commands. It is a single file that contains all the files and settings to compile a project and link it with the appropriate libraries.
For simple projects with uncomplicated settings, you can build without a makefile by directly invoking a compiler like GCC, e.g. gcc file1.c file2.c file3.c compiles three files and links them together into an executable named a.out. You could add flags such as -Wall (for warnings) or -std=gnu99 (to use the updated GNU99 specification), or -o [name] to set the name of the resulting executable. However, manually re-typing these compilation commands quickly becomes tedious as projects get even slightly complex, and it is easy to mistype or be inconsistent. Managing the build with a makefile is much more convenient and less error-prone.
For our purposes, you will not need to know too much about Make, except how to use it. All CS107 projects will be distributed with a pre-written Makefile which you can usually use as-is. What is very important, however, is that you need to remember to run make after any change to the source code of your programs – many students forget to run make and wonder why they get unexpected results from their programs, when it is simply that they never re-compiled their code after the changes!
The simplest way to use make is by typing make in a directory that contains a “Makefile” called, fittingly, Makefile:
$ make
gcc -g -Og -std=gnu99  -o hello helloWorld.c helloLanguages.c
$ ./hello
Hello World
Hallo Welt
Bonjour monde
Here is an example Makefile for the program above with the following files: hello.h, helloLanguages.c, helloWorld.c:
#
# A very simple makefile
#

# The default C compiler
CC = gcc

# The CFLAGS variable sets compile flags for gcc:
#  -g          compile with debug information
#  -Wall       give verbose compiler warnings
#  -O0         do not optimize generated code
#  -std=gnu99  use the GNU99 standard language definition
CFLAGS = -g -Wall -O0 -std=gnu99

hello: helloWorld.c helloLanguages.c hello.h
    $(CC) $(CFLAGS) -o hello helloWorld.c helloLanguages.c

.PHONY: clean

clean:
    rm -f hello *.o
Note that lines beginning with ‘#’ are comments, and are ignored when the makefile is processed.
The Makefile has rules that are followed to decide when to compile a program. In particular, the hello: line in the Makefile tells Make to re-compile the program if any of the three files (hello.c, helloLanguages.c, and hello.h) have changed. On the following line, which must begin with a tab and not spaces (if you don’t do this, you’ll get a “missing separator” error!), the compilation line runs. There are two variables in this Makefile, CC (the compiler), and CFLAGS (the flags that we are going to send to the compiler).
A commonly-included second rule, clean:, allows you to write make clean and remove all files associated with compiling that program. (The first rule listed in the Makefile is executed by default when you type make, which is why you don’t have to write make hello each time).
See how to compile with gcc for information about how the compilation happens.
Extra: More About Makefiles
While you don’t need to know much about Makefiles in order to compile your assignments, read on if you’re interested in learning more about the details behind writing a Makefile. Checking out makefiles from some real world projects is another interesting way to see make in action.
Below is a longer Makefile that might be used to build a larger project:
#
# A simple makefile for managing build of project composed of C source files.
#


# It is likely that default C compiler is already gcc, but explicitly
# set, just to be sure
CC = gcc

# The CFLAGS variable sets compile flags for gcc:
#  -g          compile with debug information
#  -Wall       give verbose compiler warnings
#  -O0         do not optimize generated code
#  -std=gnu99  use the GNU99 standard language definition
CFLAGS = -g -Wall -O0 -std=gnu99

# The LDFLAGS variable sets flags for linker
#  -lm   says to link in libm (the math library)
LDFLAGS = -lm

# In this section, you list the files that are part of the project.
# If you add/change names of source files, here is where you
# edit the Makefile.
SOURCES = demo.c vector.c map.c
OBJECTS = $(SOURCES:.c=.o)
TARGET = demo


# The first target defined in the makefile is the one
# used when make is invoked with no argument. Given the definitions
# above, this Makefile file will build the one named TARGET and
# assume that it depends on all the named OBJECTS files.

$(TARGET) : $(OBJECTS)
    $(CC) $(CFLAGS) -o $@ $^ $(LDFLAGS)

# Phony means not a "real" target, it doesn't build anything
# The phony target "clean" is used to remove all compiled object files.
# 'core' is the name of the file outputted in some cases when you get a
# crash (SEGFAULT) with a "core dump"; it can contain more information about
# the crash.
.PHONY: clean

clean:
    rm -f $(TARGET) $(OBJECTS) core
Let’s go through this makefile and see what’s there.
Macros
These are the substitutions defined toward the top of the makefile (lines that look like CFLAGS = -g -Wall). They are similar to #define statements in C, and should be used for any expression which is likely to be used repeatedly in a makefile. Once a macro has been assigned, we can reference it later using $(MACRO_NAME) (e.g. $(CFLAGS) in the example above). When we type make in a terminal, the file parser will simply replace these macro references with the assigned content.
Diving deeper, the line OBJECTS = $(SOURCES:.c=.o) defines the OBJECTS macro to be the same as the SOURCES macro, except that every instance of ‘.c’ is replaced with ‘.o’ - that is, this assignment is equivalent to OBJECTS = demo.o vector.o map.o. There are also two built-in macros used by the makefile, $@ and $^; these evaluate to demo and demo.o vector.o map.o, respectively, but we will need to learn a bit about targets before we find out why.
For clarity, it may be worth looking at the content of the makefile as the parser “sees” it, with comments removed and macros fully expanded. In this form, our sample makefile looks like:
demo : demo.o vector.o map.o
    gcc -g -Wall -O0 -std=gnu99 -o demo demo.o vector.o map.o -lm

.PHONY: clean

clean:
    rm -f demo demo.o vector.o map.o core
Targets
Following our makefile’s macro definitions, we see a number of targets. Targets and their associated actions are written in the form:
target-name : dependencies
    action
The target name is generally the name of the file that will be produced when this target is built. The first target listed in a makefile is the default target, meaning that it is the target which is built when make is invoked with no arguments; other targets can be built using make [target-name] at the command line. It is also worth mentioning at this point that the Make utility recognizes a number of implicit targets, and in particular that each of our object files has an associated implicit target equivalent to:
[filename].o : [filename].c
    $(CC) $(CFLAGS) -o [filename].o [filename].c
Much of the power of the Make utility comes from its handling of dependencies. The dependencies of a target are the files which need to exist and be up to date before the target itself can be built. In the example above, the demo target depends on three object files (each of which can be built with its own implicit target as specified). Make processes dependencies recursively; if particular dependency has an associated target, the Make utility will (re)build the dependency’s target before processing the parent target, ensuring that all dependencies are up to date before the parent target is processed. Thus, for our sample makefile, the command make demo actually behaves more like make demo.o ; make vector.o ; make map.o ; make demo (the recursion ends at dependencies which don’t have an associated target; this occurs if, for example, we’re depending on a source file like demo.c, as is the case with the demo.o target). The Make utility will then examine the timestamps of each file on which the parent target depends, and will build the parent target if any of these files have been changed more recently than the parent file (or if the parent file does not yet exist). In our case, this means that if the demo executable already exists in our directory, make demo will not do anything unless the directory’s object files need to be rebuilt during recursive dependency processing, which in turn will only occur if any of our source files (demo.c, vector.c, map.c) have been modified more recently than their associated object file was built. Thus if we haven’t modified any of our source files, invoking make demo repeatedly will only build the demo executable once. Furthermore, if we modify just one of our source files, we will only rebuild the associated object file, rather than all three object files. In large-scale projects, these sorts of optimizations can save hours of compilation time whenever a project is built.
Finally, each target has an associated command, which will be run in the shell in order to build the target. Generally, this is a command which invokes the compiler, but technically it can be any command which creates a file with the target’s name. When defining the command for a target, we also have access to a number of special macros, such as $@ and $^ above. We can see now that these macros evaluate, respectively, to the name of the current target and its list of dependencies. Other such target-dependent macros exist, and information on them is available in the Make documentation.
Phony targets: Note that the clean target in our sample Makefile doesn’t actually create a file named ‘clean’, and thus doesn’t fit the pattern which we’ve been describing for targets. Rather, the clean target is used as a shortcut for running a command which clears out the project’s build files (the ‘@’ at the beginning of the command tells Make not to print it to the terminal when it is being run). We flag targets like this by listing them as “dependencies” of .PHONY, which is a pseudo-target that we’ll never actually build. When the Make utility encounters a phony target, it will run the associated command automatically, without performing any dependency checks.
Even More
If you’re interested in learning even more about make, check out the following resources:
- the full make manual (from GNU)
- Section 2 of this Stanford Unix Programming Tools document
- the No-starch press “Gnu Make Book” (requires authentication, accesses Stanford’s subscription to Safari Books Online).
Compiling C Programs with GCC
Click here for a walkthrough video.
The compiler we will use for CS107 is called the “GNU Compiler Collection” (gcc). It is one of the most widely used compilers, and it is both Free Software, and available on many different computing platforms.
gcc performs the compilation step to build a program, and then it calls other programs to assemble the program and to link the program’s component parts into an executable program that you can run. We will learn a bit about each of those steps during CS107, but the nice thing is that gcc can produce the entire executable (runnable) program for you with one command.
In CS107, we will predominantly use Makefiles to compile, assemble, and link our code, but the Makefile runs gcc to do the work. This is just a quick overview on how to compile and run your own programs should you decide to do so without a Makefile.
The simplest way to run gcc is to provide gcc a list of .c files:
$ gcc hello.c
$
Note that you do not put header files (.h) into the gcc command: it reads in the header files as it compiles, based on the #include statements inside .c files.
If the program compiled without errors or warnings, you don’t get any output from gcc, and you will have a new file in your directory, called a.out. To run this file, you need to tell the shell to run the file in the current directory, by using ./ before the name:
$ ./a.out
Hello, World!
$
We generally don’t want our programs named a.out, so you can give gcc an option, -o programName, to tell it what to name the runnable file:
$ gcc hello.c -o hello
$ ./hello
Hello, World!
$
Note: be careful not to accidentally input a runnable file name that is the same as your input file - something like:
$ gcc hello.c -o hello.c
On myth, your profile has been set up to catch the error and not compile it, leaving your source file in tact. This is not the case on many other Linux systems, so be careful! On other systems, GCC would overwrite your source file with the new executable.
gcc takes many different command line options (flags) that change its behavior. One of the most common flags is the “optimization level” flag, -O (uppercase ‘o’). gcc has the ability to optimize your code for various situations.
- -O or -O1: Optimize. Optimizing compilation takes somewhat more time, and a lot more memory for a large function. With
-O, the compiler tries to reduce code size and execution time, without performing any optimizations that take a great deal of compilation time. - -O2: Optimize even more. GCC performs nearly all supported optimizations that do not involve a space-speed tradeoff. As compared to
-O, this option increases both compilation time and the performance of the generated code. - -O3: Optimize yet more.
-O3turns on all optimizations specified by-O2and also turns on other optimizations. This is often the best option to use. - -O0: Reduce compilation time and make debugging produce the expected results. This is the default.
- -Os: Optimize for size.
-Osenables all-O2optimizations that do not typically increase code size. It also performs further optimizations designed to reduce code size. - -Ofast: Disregard strict standards compliance.
-Ofastenables all-O3optimizations. It also enables optimizations that are not valid for all standard compliant programs. - -Og: Optimize debugging experience.
-Ogenables optimizations that do not interfere with debugging. It should be the optimization level of choice for the standard edit-compile-debug cycle, offering a reasonable level of optimization while maintaining fast compilation and a good debugging experience. We will use-Ogin CS107 when we are debugging.
See the man page for gcc for more details on optimization (or see here for more information about optimizations).
Another common flag is the -std=gnu99 option, which tells gcc to use the “gnu c version of the 1999 c standard.” The standard provides syntax such as being able to define a variable inside a for loop declaration (e.g., for (int i = ...). We will use this standard in CS107.
We will also use the -g flag, which allows us to use the debugger, gdb, to give us exact line numbers in our code when we run it.
Example:
$ gcc -std=gnu99 -g -Og loop.c -o loop
If you’re interested in even more information about gcc, check out Section 1 of this Stanford Unix Programming Tools document, as well as the full gcc manual(GNU).
GDB and Debugging
Click here for a walkthrough video.
In CS106A and CS106B, you may have used a graphical debugger; these debuggers were built into the program you used to write your code, and allowed you to set breakpoints, step through your code, and see variable values, among other features. In CS107, the debugger we are using is a separate program from your text editor, called gdb (the “GNU Debugger”). It is a command-line debugger, meaning that you interact with it on the command line using text-based commands. But it shares many similarities with debuggers you might have already used; it also allows you to set breakpoints, step through your code, and see variable values. We recommend familiarizing yourself with how to use gdb as soon as possible.
This page will list the basic gdb commands you will need to use as you progress through CS107. However, it takes practice to become proficient in using the tool, and gdb is a large program that has a tremendous number of features. See the bottom of the page for more resources to help you master gdb.
Getting Started
Before you start using gdb, you’ll want to configure it to use the CS107 default preferences; this sets up the debugger to know things like our work will be in 64-bit systems. To do this, execute the following command after logging into myth:
wget https://cs107.stanford.edu/resources/sample_gdbinit -O ~/.gdbinit
gdb looks for a special .gdbinit file on your system to know what preferences you would like, and this command downloads our pre-made .gdbinit file and puts it on your system. If you don’t do this, some behavior may not match guides and examples in CS107.
Compiling for gdb: gcc does not automatically put debugging information into the executable program, but our Makefiles all include the -g -Og flags that give gdb information about our programs so we can use the debugger efficiently.
Running gdb
gdb takes as its argument the executable file that you want to debug. This is not the .c file or the .o file, instead it is the name of the compiled program:
$ gdb myprogram
GNU gdb (Ubuntu 7.7.1-0ubuntu5~14.04.3) 7.7.1
Copyright (C) 2014 Free Software Foundation, Inc.
License GPLv3+: GNU GPL version 3 or later <http://gnu.org/licenses/gpl.html>
This is free software: you are free to change and redistribute it.
There is NO WARRANTY, to the extent permitted by law.  Type "show copying"
and "show warranty" for details.
This GDB was configured as "x86_64-linux-gnu".
Type "show configuration" for configuration details.
For bug reporting instructions, please see:
<http://www.gnu.org/software/gdb/bugs/>.
Find the GDB manual and other documentation resources online at:
<http://www.gnu.org/software/gdb/documentation/>.
For help, type "help".
Type "apropos word" to search for commands related to "word"...
Reading symbols from square...done.
(gdb)
The (gdb) prompt is where you start typing your commands. Note that nothing has happened yet - your program has not started running to debug - gdb is simply awaiting further instructions.
Once you’ve got the (gdb) prompt, the run command (shorthand: r) starts the executable running. If the program you are debugging requires any command-line arguments, you specify them to the run command. To run myprogram with the arguments “hi” and “there”, for instance, you would type the following:
(gdb) run hello world
Starting program: /cs107/myprogram hi there
This starts the program running. When the program stops, you’ll get your (gdb) prompt back.
Breakpoints
Normally, your program only stops when it exits. Breakpoints allow you to pause your program’s execution wherever you want, be it at a function call or a particular line of code, and examine the program state.
Before you start your program running, you want to set up your breakpoints. The break command (shorthand: b) allows you to do so.
To set a breakpoint at the beginning of the function named main:
(gdb) break main
Breakpoint 1 at 0x400a6e: file myprogram.c, line 44.
To set a breakpoint at line 47 in myprogram.c:
(gdb) break myprogram.c:47
Breakpoint 2 at 0x400a8c: file myprogram.c, line 47.
If there is only once source file, you do not need to include the filename.
Each breakpoint you create is assigned a sequentially increasing number (the first breakpoint is 1, the second 2, etc.).
If you want to delete a breakpoint, just use the delete command (shorthand: d) and specify the breakpoint number to delete.
To delete the breakpoint numbered 2:
(gdb) delete 2
If you lose track of your breakpoints, or you want to see their numbers again, the info break command lets you know the breakpoint numbers:
(gdb) info break
Num     Type           Disp Enb Address            What
1       breakpoint     keep y   0x0000000000400a6e in main at myprogram.c:44
Finally, notice that it’s much easier to remember function names than line numbers (and line numbers change from run to run when you’re changing your code), so ideally you will set breakpoints by name. If you have decomposed your code into small, tight functions, setting breakpoints will be easy. On the other hand, wading through a 50-line function to find the right place for a breakpoint is unpleasant, so yet another reason to decompose your code cleanly from the start!
Extra: Conditional Breakpoints
You can set breakpoints to only trigger when certain conditions in your code are true. For instance, say you have the following loop in your code:
1    for (int i = 0; i < count; i++) {
2        ...
3    }
If you wanted to step through the code inside the loop just the last time the loop executed, with a normal loop you may have to skip over many program breaks before you get to the part you want to examine. However, gdb lets you add an optional condition (in C code syntax) for when the breakpoint should be stopped at:
(gdb) break 2 if i == count - 1
The format is [BREAKPOINT] if [CONDITION]. Now this breakpoint will only be hit the last time around the loop! You can even use local variables in your expression, as shown above with i and count. Experiment to see what other useful conditions you might use.
The following sections deal with things you can do when you’re stopped at a breakpoint, or when you’ve encountered a segfault.
Examining Program State
Backtrace
Easily one of the most immediately useful things about gdb is its ability to give you a backtrace (or a “stack trace”) of your program’s execution at any given point. This works especially well for locating things like crashes (“segfaults”). If a program named reassemble segfaults while running in GDB during execution of a function named read_frag, gdb will print the following information:
Program received signal SIGSEGV, Segmentation fault.
0x0000000000400ac1 in read_frag (fp=fp@entry=0x603010, nread=nread@entry=0) at reassemble.c:51
51      if (strlen(unusedptr) == MAX_FRAG_LEN)
Not only is this information vastly more useful than the terse “Segmentation fault” error that you get outside of gdb, you can use the backtrace command to get a full stack trace of the program’s execution when the error occurred:
(gdb) backtrace
#0  0x0000000000400ac1 in read_frag (fp=fp@entry=0x603010, nread=nread@entry=0) at reassemble.c:51
#1  0x0000000000400bd7 in read_all_frags (fp=fp@entry=0x603010, arr=arr@entry=0x7fffffff4cb0, maxfrags=maxfrags@entry=5000) at reassemble.c:69
#2  0x00000000004010ed in main (argc=<optimized out>, argv=<optimized out>) at reassemble.c:211
Each line represents a stack frame (ie. a function call). Frame #0 is where the error occurred, during the call to read_frag. The hexadecimal number 0x0000000000400ac1 is the address of the instruction that caused the segfault (don’t worry if you don’t understand this, we’ll get to it later in the quarter). Finally, you see that the error occurred from the code in reassemble.c, on line 51. All of this is helpful information to go on if you’re trying to debug the segfault.
Variables and Expressions
You’re likely to want to check into the values of certain key variables at the time of the problem. The print command (shorthand: p) is perfect for this. To print out the value of variables such as nread, fp and start:
(gdb) print nread
$1 = 0
(gdb) print fp
$2 = (FILE *) 0x603010
(gdb) print start
$3 = 123 '{'
You can also use print to evaluate expressions, make function calls, reassign variables, and more.
Sets the first character of buffer to be ‘a’:
print buffer[0] = 'Z'
$4 = 90 'Z'
Print result of function call:
(gdb) print strlen(buffer)
$5 = 10
The following commands are handy for quickly printing out a group of variables in a particular function:
info args prints out the arguments (parameters) to the current function you’re in:
(gdb) info args
fp = 0x603010
nread = 0
info locals prints out the local variables of the current function:
(gdb) info locals
start = 123 '{'
end = 125 '}'
nscanned = 3
Stack Frames
If you’re stopped at a breakpoint or at an error, you may also want to examine the state of stack frames further back in the calling sequence. You can use the up and down commands for this.
up moves you up one stack frame (e.g. from a function to its caller)
(gdb) up
#1  0x0000000000400bd7 in read_all_frags (fp=fp@entry=0x603010, arr=arr@entry=0x7fffffff4cb0, maxfrags=maxfrags@entry=5000) at reassemble.c:69
69          char *frag = read_frag(fp, i);
down moves you down one stack frame (e.g. from the function to its callee)
(gdb) down
#0  0x0000000000400ac1 in read_frag (fp=fp@entry=0x603010, nread=nread@entry=0) at reassemble.c:51
51      if (strlen(unusedptr) == MAX_FRAG_LEN)
The commands above are really helpful if you’re stuck at a segfault and want to know the arguments and local vars of the faulting function’s caller (or that function’s caller, etc.).
Controlling Execution
run will start (or restart) the program from the beginning and continue execution until a breakpoint is hit or the program exits. start will start (or restart) the program and stop execution at the beginning of the main function.
Once stopped at a breakpoint, you have choices for how to resume execution. continue (shorthand: c) will resume execution until the next breakpoint is hit or the program exits. finish will run until the current function call completes and stop there. You can single-step through the C source using the next (shorthand: n) or step (shorthand: s) commands, both of which execute a line and stop. The difference between these two is that if the line to be executed is a function call, next executes the entire function, but step goes into the function implementation and stops at the first line.
Useful Tips
- If you’re using a Makefile, you can recompile from within
gdbso that you don’t have to exit and lose all your breakpoints. Just typemakeat the (gdb) prompt, and it will rebuild the executable. The next time yourun, it will reload the updated executable and reset your existing breakpoints. - Use
gdbinside Emacs! It’s just another reason why Emacs is really cool. Use “Ctrl-x 3” to split your Emacs window in half, and then use “Esc-x gdb” or “Alt-x gdb” to start upgdbin your new window. If you are physically at one of the UNIX machines, or if you have X11 forwarding enabled, your breakpoints and current line show up in the window margin of your source code file. - If you simply type the enter key, the last command will be re-run. This is nice if you are stepping through a program line-by-line: you can use the
nextcommand once, and then hitting the enter key will re-run thenextcommand again without you having to type the command.
Debugging Strategies
Along with gdb, it’s important to use good debugging strategies when working on your programs. Many students have up to now done all their debugging via print statements. That works for simple cases, but becomes unwieldy as programs get larger and have more complex interactions. Now is the time to invest in mastering the powerful tools provided by a debugger like gdb, and using a careful and systematic debugging approach:
-
Observe the bug. If you never see the bug, you’ll likely never fix it. Another reason you want comprehensive testing!
-
Create a reproducible input. Creating a trivial input that reliably induces the failure is a huge help.
-
Narrow the search space. Studying the entire program or tracing the execution line-by-line is generally not feasible. Some suggestions for how to narrow down your focus :
- Start where your intuition believes is the likely culprit, such as a function that recently changed or one you find suspicious.
- Use binary search to dissect. Set a breakpoint at the midpoint and poke around to determine whether the program state is already corrupt (which indicates the problem is in the front half) or looks good (so you need to focus your attention on the back half). Repeat to further narrow down.
- Run under Valgrind to identify the root cause of any lurking memory errors.
- Run under GDB to identify the root cause of any crashes
-
Analyze. With only a small amount of code under scrutiny, execution tracing becomes feasible. Use
gdbto see what the facts (values of variables and flow of control) are telling you. Drawing pictures may help. -
Devise and run experiments. Make inferences about the root cause and run experiments to validate your hypothesis. Iterate until you identify the root cause.
-
Modify code to squash bug. The fix should be validated by your experiments and passing the original failed test case. You should be able explain the series of facts, tests, and deductions which match the observed symptom to the root cause and the corrected code.
Do not change your code haphazardly. This is like a scientist who changes more than one variable at a time. It makes the observed behavior much more difficult to interpret, and tends to introduce new bugs. That said, if you find buggy code, even if it is not obviously related to the bug you are tracking, you still might want to make a detour to fix it, using a reproducible input to trigger that bug and validate its fix. That bug might be related to or obscuring the original bug and it’s good to remove any source of potential interference.
gdb Commands Reference
Here is a full list of the commands you’ll want to be familiar with. For even more, check out this gdb Quick Reference document.
| Command | Abbreviation | Description |
|---|---|---|
help [command] | h [command] | Provides help (information) about a particular command or keyword. |
apropos [command] | appr [command] | Same as help |
info [cmd] | i [cmd] | Provides information about your program, such as the breakpoints (info breakpoints, local variables (info locals), parameters (info args), breakpoint numbers (info break), etc. |
run [args] | r [args] | The run command runs your program. You can enter command line arguments after the command, if your program requires them. If you are already running your program and you want to re-run it, you should answer y to the prompt that says, “The program being debugged has been started already. // Start it from the beginning? (y or n)” |
list | l | The list command lists your program code either from the beginning, or with a range around where you are currently stopped. |
next | n | The next command steps to the next program line and completely runs functions. This is important: if you have a function (even one you didn’t write) and you use next, the function will run to completion, and will stop at the next line after the function (unless there is a breakpoint inside the function). |
step | s | The step command is similar to next, but it will step into functions. This means that it will attempt to go to the first line in a function if there is a function called on the current line. Importantly, it will also take you into functions you didn’t write (such as printf), which can be annoying (you should use next instead). If you do accidentally step into a function, you can use the finish command to finish the function immediately and go back to the next line after the function. |
continue | c | This will continue running the program until the next breakpoint or until the program ends. |
print [x] | p [x] | This very important command lets you see the value of a variable [x] when you are stopped in a program. If you see the error “No symbol xxxx in current context”, or the error, “optimized out”, you probably aren’t in a place in the program where you can read the variable. |
break [x] | b [x] | This will put a breakpoint in the program at a specified function name or a particular line number. If you have multiple files, you should use file:lineNum when specifying the line number (e.g. source.c:57). |
clear [x] | Removes the breakpoint at a specified line number or at the start of the specified function. | |
delete [x] | Removes the breakpoint with the given number. If the number is omitted, deletes all breakpoints after confirming. | |
backtrace | bt | This will print a stack trace to let you know where in the program you are currently stopped. This is a useful command if your program has a segmentation fault: the backtrace command will tell you the last place in your program that had the problem (sometimes you need to look at the entire stack trace to go back to the last line your program tried to execute). |
up and down | These commands allow you to go up and down the stack trace. For instance, if you are inside a function and what to see the status of variables from the calling function, you can use up to place the program into the calling function, and then use p variable to look at the state of the program in that function. You would then use down to go back to the function that was called. | |
finish | Runs a function until it completes, which is helpful if you accidentally step into a function. | |
disassemble | disas | Disassembles your program into assembly language. We will be discussing this in depth in cs107. |
ctrl-x, ctrl-a | Go into or leave “TUI” mode: gdb has a mode that shows you source code, or assembly output in a manner that allows you to scroll up and down. It is useful but sometimes can be a bit buggy. You will want to use the ctrl-l command to refresh the display. | |
quit | q | Quit gdb |
Example gdb Session
Below, we’ve included a program and a sample usage of GDB - lines that start with (gdb) # some text are comments. Also see this video for a walkthrough demonstration of gdb.
We will be looking at this simple program below:
#include<stdlib.h>
#include<stdio.h>

int square(int x);

int main(int argc, char *argv[]) {
    printf("This program will square an integer.\n");

    // the program should have one number as an argument
    if (argc != 2) {
        printf("Usage:\n\t./square number\n");
        return 0;
    }

    // the first argument after the filename
    int numToSquare = atoi(argv[1]);

    int squaredNum = square(numToSquare);

    printf("%d squared is %d\n",numToSquare,squaredNum);

    return 0;
}


int square(int x) {
    int sq = x * x;
    return sq;
}
The sample GDB run output can be found here.
More Resources
If you’re interested in even more information about gdb, check out the following resources:
- This gdb Reference Card
- Section 3 of this Stanford Unix Programming Tools document
- The full gdb manual (from GNU)
- This extensive gdb guide
- Two gdb articles written by Julie Zelenski, another Stanford Lecturer, for a programming journal: Breakpoint Tricks and GDB’s Greatest Hits
Frequently-Asked Questions
When I run my program under gdb, it complains about missing symbols. What is wrong?
gdb myprogram
Reading symbols from myprogram...(no debugging symbols found)...done.
(gdb)
This means the program was not compiled with debugging information. Without this information, gdb won’t have full symbols for setting breakpoints or printing values or other program tracing features. There’s a flag you need to pass to gcc to build debugging info into the executable. If you’re using raw gcc, add the -g flag to your command. If you’re using a Makefile, make sure the CFLAGS line includes the -g flag.
When I view my code from within in gdb, it warns that the source file is more recent. What does this mean?
(gdb) list
warning: Source file is more recent than executable.
This means that you have edited one or more of your .c source files, but have not recompiled those changes. The program being executed will not match the edited source code and gdb’s efforts to try to match up the two will be hopelessly confused. You can quit out of gdb, make, and then restart gdb, or even more conveniently, make from with gdb will rebuild the program and reload it at next run, all without leaving gdb.
I step into a library function and gdb complains about a missing file. What is this and what should I do about it?
(gdb) s
_IO_new_fopen (filename=0xffffdc9f "samples/input", mode=0x804939a "r") at iofopen.c:102
102 iofopen.c: No such file or directory.
The step command usually executes the next single line of C code. If that line makes a function call, step will advance into that function and allow you trace inside the call. However, if the function is a library function, gdb will not be able to display/trace inside it because the necessary source files are not available on the system. Thus, if asked to step into a library call, gdb responds with this harmless complaint about “No such file”. At that point, you can use finish to continue through the current function. As alternative to step, the next command will execute the entirety of the next line, completing all function calls rather than attempting to step into them.
My program crashes within a library function. It’s not my fault the library is broken! What can I do?
Program received signal SIGSEGV, Segmentation fault.
__strcmp_ssse3 () at ../sysdeps/i386/i686/multiarch/strcmp-ssse3.S:232
232 ../sysdeps/i386/i686/multiarch/strcmp-ssse3.S: No such file or directory.
The example crash shown above is occurring during a call to strcmp, a function from the standard library. The arguments to strcmp are expected to be valid char*s. If given an invalid address, the function will crash trying to read from that location. The library function does not have a bug, the mistake is that you are passing an invalid argument; look at your call to strcmp to resolve your bug. The complaint about missing files (discussed above) is a harmless warning you can safety ignore. On the other hand, the bug in your use of the library function needs to be investigated further! :-)
When I start gdb, it gives a long warning about auto-loading being declined. What’s wrong?
Reading symbols from bomb...(no debugging symbols found)...done.
warning: File "/afs/ir.stanford.edu/users/z/e/zelenski/a5/.gdbinit" auto-loading has been declined by your `auto-load safe-path' set to "$debugdir:$datadir/auto-load".
To enable execution of this file add
    add-auto-load-safe-path /afs/ir.stanford.edu/users/z/e/zelenski/a5/.gdbinit
line to your configuration file "/afs/ir/users/z/e/zelenski/.gdbinit".
... blah blah blah ...
A .gdbinit file is used to set a startup sequence for gdb. However, for security reasons, loading from a local .gdbinit is disabled by default. If there is a .gdbinit in the current directory and you have not configured gdb to allow loading it, gdb complains to alert you that this .gdbinit file is being ignored. To enable loading, you must edit your personal gdb configuration file to change your auto-load setting. Your personal gdb configuration is ~/.gdbinit (a hidden file in your home directory). A .gdbinit file is a plain text file you can edit with your favorite editor. If file doesn’t yet exist, you will need to create it. The line you need to add is set auto-load safe-path /. Alternatively, you can copy and paste the command below to append the proper setting to your personal configuration file, creating the file if it doesn’t already exists. You will need to make this configuration change only once.
bash -c 'echo set auto-load safe-path / >> ~/.gdbinit'
You can check your current configuration by searching your personal configuration file for the setting. See command below and expected response:
myth> grep auto-load ~/.gdbinit
set auto-load safe-path /
Once your personal configuration is appropriately set, there will be no further complaints from gdb about declining auto-load and it will load any local .gdbinit file on start.
When my program finishes, gdb prints a message calling my program “inferior”. What have I done to offend gdb?
[Inferior 1 (process 25178) exited normally]
                  or
[Inferior 1 (process 25609) exited with code 01]
Don’t take it personally, gdb runs your program as a sub-process which it terms the “inferior”. The message indicates the program has run to completion and exited in a controlled fashion– there was no segmentation fault, abort, hang, or other catastrophic termination condition.
When I run gdb without a program, some things (like sizeof and typecasts) behave differently. What’s happening?
myth$ gdb
(gdb) p sizeof(long)
$1 = 4
(gdb) p/x (long)-1
$2 = 0xffffffff
(gdb)
By default, gdb determines your CPU architecture based on the program you’re debugging. If you don’t specify a program when starting gdb, it defaults to assuming a 32-bit system, rather than the 64-bit system that all of the programs we write will use. Starting gdb on one of your CS107 programs (any one will do) will cause gdb to use the proper architecture. You can also manually put gdb into 64-bit mode with the following command:
set architecture i386:x86-64
After that, the above commands should now print correctly:
myth$ gdb
(gdb) set architecture i386:x86-64
The target architecture is assumed to be i386:x86-64
(gdb) p sizeof(long)
$1 = 8
(gdb) p/x (long)-1
$2 = 0xffffffffffffffff
(gdb)
Valgrind Memcheck
Click here for a walkthrough video.
Valgrind Memcheck is a tool that detects memory leaks and memory errors. Some of the most difficult C bugs come from mismanagement of memory: allocating the wrong size, using an uninitialized pointer, accessing memory after it was freed, overrunning a buffer, and so on. These types of errors are tricky, as they can provide little debugging information, and tracing the observed problem back to underlying root cause can be challenging. Valgrind is here to help!
Memory Errors Vs. Memory Leaks
Valgrind reports two types of issues: memory errors and memory leaks. When a program dynamically allocates memory and forgets to later free it, it creates a leak. A memory leak generally won’t cause a program to misbehave, crash, or give wrong answers, and is not an urgent situation. A memory error, on the other hand, is a red alert. Reading uninitialized memory, writing past the end of a piece of memory, accessing freed memory, and other memory errors can have significant consequences. Memory errors should never be treated casually or ignored. Although this guide describes about how to use Valgrind to find both, keep in mind that errors are by far the primary concern, and memory leaks can generally be resolved later.
Running A Program Under Valgrind
Like the debugger, Valgrind runs on your executable, so be sure you have compiled an up-to-date copy of your program. Run it like this, for example, if your program is named memoryLeak:
$ valgrind ./memoryLeak
Valgrind will then start up and run the specified program inside of it to examine it. If you need to pass command-line arguments, you can do that as well:
$ valgrind ./memoryLeak red blue
When it finishes, Valgrind will print a summary of its memory usage. If all goes well, it’ll look something like this:
==4649== ERROR SUMMARY: 0 errors from 0 contexts
==4649== malloc/free: in use at exit: 0 bytes in 0 blocks.
==4649== malloc/free: 10 allocs, 10 frees, 2640 bytes allocated.
==4649== For counts of detected errors, rerun with: -v
==4649== All heap blocks were freed -- no leaks are possible.
This is what you’re shooting for: no errors and no leaks. Another useful metric is the number of allocations and total bytes allocated. If these numbers are the same ballpark as our sample (you can run solution under valgrind to get a baseline), you’ll know that your memory efficiency is right on target.
Finding Memory Errors
Memory errors can be truly evil. The more overt ones cause spectacular crashes, but even then it can be hard to pinpoint how and why the crash came about. More insidiously, a program with a memory error can still seem to work correctly because you manage to get “lucky” much of the time. After several “successful” outcomes, you might wishfully write off what appears to be a spurious catastrophic outcome as a figment of your imagination, but depending on luck to get the right answer is not a good strategy. Running under valgrind can help you track down the cause of visible memory errors as well as find lurking errors you don’t even yet know about.
Each time valgrind detects an error, it prints information about what it observed. Each item is fairly terse– the kind of error, the source line of the offending instruction, and a little info about the memory involved, but often it is enough information to direct your attention to the right place. Here is an example of valgrind running on a buggy program:
==4651== Invalid write of size 1
==4651==    at 0x80486A4: main (myprogram.c:58)
==4651==  Address 0x4449054 is not stack'd, malloc'd or (recently) free'd
==4651==
==4651== ERROR SUMMARY: 1 errors from 1 contexts
==4651== malloc/free: in use at exit: 0 bytes in 0 blocks.
==4651== malloc/free: 1 allocs, 1 frees, 10 bytes allocated.
==4651== For counts of detected errors, rerun with: -v
==4651== All heap blocks were freed -- no leaks are possible.
The ERROR SUMMARY says there is one error, an invalid write of size 1 (byte, that is). The bad write operation was observed at line 58 in myprogram.c. Let’s look at the code:
56     ...
57     char *copy = malloc(strlen(buffer));
58     strcpy(copy, buffer);
59     ...
Looks like an instance of the classic strlen + 1 bug. The code doesn’t allocate enough space for the ‘\0’ character, so when strcpy went to write it at frag[strlen(buffer)], it accessed memory beyond the end of the malloc’ed piece. Despite the code being clearly wrong, it often may appear to “work” because malloc commonly rounds up the requested size to the nearest multiple of 4 or 8 and that extra space may cover the shortfall. “Getting away with it” can lead you to a false sense of security about the code being correct. The next run might get a strange crash that you might write off as a fluke. But vigilantly using valgrind can inform you of the error so you can find and fix it, rather than wait for an observed symptom that may be hard to reproduce.
There are different kinds of memory errors that you may see in the valgrind reports. The most common are:
Invalid read/write of size XThe program was observed to read/write X bytes of memory that was invalid. Common causes include accessing beyond the end of a heap block, accessing memory that has been freed, or accessing into an unallocated region such as from use of a uninitialized pointer.Use of uninitialised valueorConditional jump or move depends on uninitialised value(s)The program read the value of a memory location that was not previously written to, i.e. uses random junk. The second more specifically indicates the read occurred in the test expression in an if/for/while. Make sure to initialize all of your variables! Remember that just declaring a variable doesn’t put anything in its contents–if you want an int to be 0 or a pointer to be NULL, you must explicitly state so. Note that Valgrind will silently allow a program to propagate an uninitialized value along from variable to variable; the complaint will only come when(if) it eventually uses the value which may be far removed from the root of the error. When tracking down an uninitialized value, run Valgrind with the additional flag--track-origins=yesand it will report the entire history of the value back to the origin which can be very helpful.Source and destination overlap in memcpy()The program attempted to copy data from one location to another and the range to be read intersects with the range to be written. Transferring data between overlapping regions usingmemcpycan garble the result;memmoveis the correct function to use in such a situation.Invalid free()The program attempted to free a non-heap address or free the same block more than once.
Memory errors in your submission can cause all sorts of varied problems (wrong output, crashes, hangs) and will be subject to significant grading deductions. Be sure to swiftly resolve any memory errors by running Valgrind early and often!
Finding Memory Leaks
You can ask Valgrind to report on memory leaks in addition to errors. When you allocate heap memory, but don’t free it, that is called a leak. For a small, short-lived program that runs and immediately exits, leaks are quite harmless, but for a project of larger size and/or longevity, a repeated small leak can eventually add up. For CS107, we will expect you to deallocate all memory at the end of program execution.
For an example, let’s take this memoryLeak.c program:
#include<stdlib.h>
#include<stdio.h>
#include<time.h>

const int ARR_SIZE = 1000;

int main() {
    // create an array of ARR_SIZE ints
    int *intArray = malloc(sizeof(int) * ARR_SIZE);

    // populate them
    for (int i=0; i < ARR_SIZE; i++) {
        intArray[i] = i;
    }

    // print one out
    // first, seed the random number generator
    srand(time(NULL));
    int randNum = rand() % ARR_SIZE;

    printf("intArray[%d]: %d\n", randNum, intArray[randNum]);

    // end without freeing!
    return 0;
}
If we compile and run this, here is the output we get:
$ gcc -g -Og -std=gnu99 memoryLeak.c -o memoryLeak
$ ./memoryLeak
intArray[645]: 645
This seems to be ok, but let’s run it under Valgrind, just to be sure:
$ valgrind ./memoryLeak
==32251== Memcheck, a memory error detector
==32251== Copyright (C) 2002-2015, and GNU GPL'd, by Julian Seward et al.
==32251== Using Valgrind-3.11.0 and LibVEX; rerun with -h for copyright info
==32251== Command: ./memoryLeak
==32251==
intArray[782]: 782
==32251==
==32251== HEAP SUMMARY:
==32251==     in use at exit: 4,000 bytes in 1 blocks
==32251==   total heap usage: 2 allocs, 1 frees, 5,024 bytes allocated
==32251==
==32251== LEAK SUMMARY:
==32251==    definitely lost: 4,000 bytes in 1 blocks
==32251==    indirectly lost: 0 bytes in 0 blocks
==32251==      possibly lost: 0 bytes in 0 blocks
==32251==    still reachable: 0 bytes in 0 blocks
==32251==         suppressed: 0 bytes in 0 blocks
==32251== Rerun with --leak-check=full to see details of leaked memory
==32251==
==32251== For counts of detected and suppressed errors, rerun with: -v
==32251== ERROR SUMMARY: 0 errors from 0 contexts (suppressed: 0 from 0)
$
It’s pretty easy to tell when there’s a leak: the alloc/free counts don’t match up and you get a LEAK SUMMARY section at the end. (note that it says 2 allocs even though we only call malloc once. Why? Because srand/time allocate memory in their implementations, but they free it as well!). Valgrind also gives a little data about each leak – how many bytes, how many times it happened, and where in the code the original allocation was made. Multiple leaks attributed to the same cause are coalesced into one entry that summarize the total number of bytes across multiple blocks. Here, the program memoryLeak.c requests memory from the heap and then ends without freeing the memory. This is a memory leak, and valgrind correctly finds the leak: “definitely lost: 4,000 bytes in 1 blocks”
Valgrind categorizes leaks using these terms:
- definitely lost: heap-allocated memory that was never freed to which the program no longer has a pointer. Valgrind knows that you once had the pointer, but have since lost track of it. This memory is definitely orphaned.
- indirectly lost: heap-allocated memory that was never freed to which the only pointers to it also are lost. For example, if you orphan a linked list, the first node would be definitely lost, the subsequent nodes would be indirectly lost.
- possibly lost: heap-allocated memory that was never freed to which valgrind cannot be sure whether there is a pointer or not.
- still reachable: heap-allocated memory that was never freed to which the program still has a pointer at exit.
These categorizations indicate whether the program has retained a pointer to the memory at exit. If the pointer is available, it will be somewhat easier to add the necessary free call, but it doesn’t change that the fact that all are leaks– that is, memory that was heap-allocated and never freed.
Given that leaks generally do not cause bugs, and incorrect deallocation can, we recommend that you do not worry about freeing memory until your program is finished. Then, you can go back and deallocate your memory as appropriate, ensuring correctness at each step.
If you want more information, you need to include the options --leak-check=full and --show-leak-kinds=all
$ valgrind --leak-check=full --show-leak-kinds=all ./memoryLeak
==4599== Memcheck, a memory error detector
==4599== Copyright (C) 2002-2015, and GNU GPL'd, by Julian Seward et al.
==4599== Using Valgrind-3.11.0 and LibVEX; rerun with -h for copyright info
==4599== Command: ./memoryLeak
==4599==
intArray[2]: 2
==4599==
==4599== HEAP SUMMARY:
==4599==     in use at exit: 4,000 bytes in 1 blocks
==4599==   total heap usage: 2 allocs, 1 frees, 5,024 bytes allocated
==4599==
==4599== 4,000 bytes in 1 blocks are definitely lost in loss record 1 of 1
==4599==    at 0x4C2DB8F: malloc (in /usr/lib/valgrind/vgpreload_memcheck-amd64-linux.so)
==4599==    by 0x4005A3: main (memoryLeak.c:9)
==4599==
==4599== LEAK SUMMARY:
==4599==    definitely lost: 4,000 bytes in 1 blocks
==4599==    indirectly lost: 0 bytes in 0 blocks
==4599==      possibly lost: 0 bytes in 0 blocks
==4599==    still reachable: 0 bytes in 0 blocks
==4599==         suppressed: 0 bytes in 0 blocks
==4599==
==4599== For counts of detected and suppressed errors, rerun with: -v
==4599== ERROR SUMMARY: 1 errors from 1 contexts (suppressed: 0 from 0)
Because we compiled with the -g flag, valgrind is able to tell us exactly where in our program the leak was created:
==4599== by 0x4005A3: main (memoryLeak.c:9)
In other words, on line 9 in memoryLeak.c, we allocated the memory and it was never freed. This can be super-helpful when debugging your programs!
For more information about Valgrind, also check out the full valgrind manual.
Frequently Asked Questions
My program runs very slowly under Valgrind. Should I be concerned?
No. Valgrind is running your program in a simulated context and monitoring the runtime activity. Depending on how memory-intensive the program is, this extra checking can slow down a program by 2-5x. This is completely expected.
Valgrind says I leaked memory because of a call to malloc() in main(), but I don’t call malloc() in main()! What’s going on?
This report can also be a result of calling a library function in main() that itself calls malloc() internally. Common examples include fopen() and strdup(). Make sure to fclose any fopened FILE*s, and free any strduped char*s.
My program runs fine and produces correct output but the Valgrind report shows memory errors. Can I ignore these?
No. An error may not have an observable runtime consequence in some situations but that doesn’t mean it doesn’t exist. The error is a ticking time bomb that can go off at anytime. Ignoring it and counting on your code continuing to “get lucky” is a risky practice. Make sure your code always runs Valgrind-clean!
My valgrind report includes an ominous-looking entry something like this: “Warning: set address range perms: large range”. What is this and do I need to worry about it?
Valgrind prints this warning when an unusually large memory region is allocated, on suspicion that the size may be so large due to an error. If the intention of your code was to allocate a large block, then all is well.
My valgrind report suggests to rerun with -v for “counts of suppressed errors”. What are these? Should I worry about them?
Pay no attention. Some library code does unusual things which can trigger reports from Valgrind even when operating correctly. Those errors/leaks are suppressed as they are known to be spurious. The -v flag causes valgrind to provide verbose commentary about its internal handling of these events. You can safely ignore all suppressed events; no need for you to wade through the verbose chatter.
When I run valgrind with no extra arguments, the ERROR SUMMARY says 0 errors, but the exact same run adding the –leak-check option then reports N errors from N contexts. Do I have errors or don’t I?
With leak-check enabled, each distinct leak found by valgrind is included in the count of errors. Without leak-check enabled (the default), it doesn’t enumerate/count leaks, so only actual memory errors are reported in the summary count.
I get a “Permission denied” message when I attempt to run a particular executable under valgrind even though I can run the program normally. How do I fix?
Valgrind refuses if you don’t have execute permission according to the file mode of the executable. The file mode is mostly irrelevant on our myth systems (the directory-based AFS permissions take precedence), but Valgrind is paying attention anyway. The command ls -l executable_file shows the file mode bits, the x’s indicate execute permission for owner/group/other. Use the command chmod a+x executable_file to enable execute permission for all users.
Valgrind Callgrind
Valgrind Callgrind is a program that can profile your code and report on its resources usage. It is another tool provided by Valgrind, which also helps detect memory issues. In fact, the Valgrind framework supports a variety of runtime analysis tools, including memcheck (detects memory errors/leaks), massif (reports on heap usage), helgrind (detects multithreaded race conditions), and callgrind/cachegrind (profiles CPU/cache performance). This tool guide will introduce you to the Valgrind callgrind profiling tool.
Code profiling
A code profiler is a tool to analyze a program and report on its resource usage (where “resource” is memory, CPU cycles, network bandwidth, and so on). The first step in program optimization is to gather factual, quantitative data from representative program execution using a profiler. The profiling data will give insights into the patterns and peaks of resource consumption so you can determine if there is a concern at all, and if so, where the problem is concentrated, allowing you to focus your efforts on the passages that most need attention. You can also measure and re-measure with the profiler to verify your efforts are bearing fruit.
Most code profilers operate via a dynamic analysis— which is to say that they observe an executing program and take live measurements—as opposed to static analysis which examines the source and predicts behavior. Dynamic profiler operate in a variety of ways: some by interjecting counting code into the program, other take samples of its activity at a high-frequency, and others run the program in a simulated environment with built-in monitoring.
The standard C/unix tool for profiling is gprof, the gnu profiler. This no-frills tool is a statistical sampler that tracks time spent at the function-level. It take regular snapshots of a running program and traces the function call stack (just like you did in crash reporter!) to observe activity. You can check out the online gprof manual if you are curious about its features and use.
The Valgrind profiling tools are cachegrind and callgrind. The cachegrind tool simulates the L1/L2 caches and counts cache misses/hits. The callgrind tool counts function calls and the CPU instructions executed within each call and builds a function callgraph. The callgrind tool includes a cache simulation feature adopted from cachegrind, so you can actually use callgrind for both CPU and cache profiling. The callgrind tool works by instrumenting your program with extra instructions that record activity and keep counters.
Counting instructions with callgrind
To profile, you run your program under Valgrind and explicitly request the callgrind tool (if unspecified, the tool defaults to memcheck).
valgrind --tool=callgrind program-to-run program-arguments
The above command starts up valgrind and runs the program inside of it. The program will run normally, albeit a bit more slowly, due to Valgrind’s instrumentation. When finished, it reports the total number of collected events:
==22417== Events    : Ir
==22417== Collected : 7247606
==22417==
==22417== I   refs:      7,247,606
Valgrind has written the information about the above 7 million collected events to an output file named callgrind.out.pid. (pid is replaced with the process id, which is 22417 in the above run, id shown in leftmost column).
The callgrind output file is a text file, but its contents are not intended for you to read yourself. Instead, you run the annotator callgrind_annotate on this output file to display the information in an useful way (replace pid with your process id):
callgrind_annotate --auto=yes callgrind.out.pid
The output from the annotator will be given in Ir counts which are “instruction read” events. The output shows total number of events occurring within each function (i.e. number of instructions executed) and displays the list of functions sorted in order of decreasing count. Your high-traffic functions will be listed at the top. The annotate option --auto=yes further breaks down the results by reporting counts for each C statement (without the auto option, you get counts summarized at the function level, which is often too coarse to be useful).
Those lines that are annotated with large instructions are your program’s “hot spots”. These high-traffic passages have large counts because they are executed many times and/or correspond to a large sequence of instructions. Working to streamline these passages will have the best bang for your buck in terms of speeding up your program.
Adding in cache simulation
In order to additionally monitor cache hits/misses, invoke valgrind callgrind with the --simulate-cache=yes option like this:
valgrind --tool=callgrind --simulate-cache=yes program-to-run program-arguments
The brief summary printed at the end will now include events collected about access to the L1 and L2 caches, as shown below:
==16409== Events    : Ir Dr Dw I1mr D1mr D1mw I2mr D2mr D2mw
==16409== Collected : 7163066 4062243 537262 591 610 182 16 103 94
==16409==
==16409== I   refs:      7,163,066
==16409== I1  misses:          591
==16409== L2i misses:           16
==16409== I1  miss rate:       0.0%
==16409== L2i miss rate:       0.0%
==16409==
==16409== D   refs:      4,599,505  (4,062,243 rd + 537,262 wr)
==16409== D1  misses:          792  (      610 rd +     182 wr)
==16409== L2d misses:          197  (      103 rd +      94 wr)
==16409== D1  miss rate:       0.0% (      0.0%   +     0.0%  )
==16409== L2d miss rate:       0.0% (      0.0%   +     0.0%  )
==16409==
==16409== L2 refs:           1,383  (    1,201 rd +     182 wr)
==16409== L2 misses:           213  (      119 rd +      94 wr)
==16409== L2 miss rate:        0.0% (      0.0%   +     0.0%  )
When you run callgrind_annotate on this output file, the annotations will now include the cache activity as well as instruction counts.
Interpreting the results
Understanding the Ir counts. The Ir counts are basically the count of assembly instructions executed. A single C statement can translate to 1, 2, or several assembly instructions. Consider the passage below that has been annotated by callgrind_annotate. The profiled program sorted a 1000-member array using selection sort. A single call to the swap function requires 15 instructions: 3 for the prologue, 3 for assign to tmp, 4 for copy from * b to * a, 3 for assign from tmp and 2 more for the epilogue. (Note that the cost of the prologue and epilogue is annotated on the opening and closing braces.) There were 1,000 calls to swap, accounting for a total of 15,000 instructions.
        . void swap(int *a, int *b)
        3,000  {
        3,000      int tmp = *a;
        4,000      *a = *b;
        3,000      *b = tmp;
        2,000  }
            .
            . int find_min(int arr[], int start, int stop)
        3,000  {
        2,000      int min = start;
    2,005,000      for(int i = start+1; i <= stop; i++)
    4,995,000          if (arr[i] < arr[min])
        6,178              min = i;
        1,000      return min;
        2,000  }
            . void selection_sort(int arr[], int n)
            3  {
        4,005      for (int i = 0; i < n; i++) {
        9,000          int min = find_min(arr, i, n-1);
    7,014,178  => sorts.c:find_min (1000x)
       10,000          swap(&arr[i], &arr[min]);
       15,000  => sorts.c:swap (1000x)
            .    }
            2  }
            .
The callgrind_annotate includes a function call summary, sorted in order of decreasing count, as shown below:
7,014,178  sorts.c:find_min [sorts]
   25,059  ???:do_lookup_x [/lib/ld-2.5.so]
   23,010  sorts.c:selection_sort [sorts]
   20,984  ???:_dl_lookup_symbol_x [/lib/ld-2.5.so]
   15,000  sorts.c:swap [sorts]
By default, the counts are exclusive-– the counts for a function include only the time spent in that function and not in the functions that it calls. For example, the 23,010 instructions counted for the selection_sort function includes the 9,000 instructions to set up and make call to find_min, but not the 7 million instructions that executed in find_min itself. The alternate means of counting is inclusive (use the option –inclusive=yes to callgrind_annotate if you prefer this way of accounting) does include the cost of sub-calls in the upper-level totals. In general, using exclusive counts is great way to highlight your bottlenecks – the functions/statements where the most time is being spent are the ones you want to reduce the number of calls or streamline what happens within a call. The most heavily trafficked passages are easily spotted by looking for the highest counts. In the code above, the work is concentrated in the loop to find the min value – techniques such as caching the min array element rather than re-fetching and unrolling the loop might be useful here.
Understanding the cache statistics. The cache simulator models a machine with a split L1 cache (separate instruction I1 and data D1), backed by a unified second-level cache (L2). This matches the general cache design of most modern machines, including our myths. The events recorded by the cache simulator are:
Ir: I cache reads (instructions executed)I1mr: I1 cache read misses (instruction wasn’t in I1 cache but was in L2)I2mr: L2 cache instruction read misses (instruction wasn’t in I1 or L2 cache, had to be fetched from memory)Dr: D cache reads (memory reads)D1mr: D1 cache read misses (data location not in D1 cache, but in L2)D2mr: L2 cache data read misses (location not in D1 or L2)Dw: D cache writes (memory writes)D1mw: D1 cache write misses (location not in D1 cache, but in L2)D2mw: L2 cache data write misses (location not in D1 or L2)
Again, the strategy is to use callgrind_annotate to report the hit/miss counts per statement and look for those statements that are contributing a large total number of read/writes or a disproportionate number of cache misses. Even a small number of misses can be quite important, as a L1 miss will typically cost around 5-10 cycles, an L2 miss can cost as much as 100-200 cycles, so shaving even a few of those can be a big boost.
Looking at the annotated result from the previous selection sort program shows the code to be quite cache-friendly – just a few misses as its traverses along the array, and otherwise, a tremendous number of I1 and D1 hits.
--------------------------------------------------------------------------------
-- Auto-annotated source: sorts.c
--------------------------------------------------------------------------------
       Ir        Dr      Dw I1mr D1mr D1mw I2mr D2mr D2mw
        .       .     .  .  .  .  .  .  . void swap(int *a, int *b)
    3,000         0   1,000    1    0    0    1    .  . {
    3,000     2,000   1,000    .  .  .  .  .  .    int tmp = *a;
    4,000     3,000   1,000    .  .  .  .  .  .    *a = *b;
    3,000     2,000   1,000    .  .  .  .  .  .    *b = tmp;
    2,000     2,000       .  .  .  .  .  .  . }
        .       .     .  .  .  .  .  .  .
        .       .     .  .  .  .  .  .  . int find_min(int arr[], int start, int stop)
    3,000         0   1,000    1    0    0    1    .  . {
    2,000     1,000   1,000    0    0    1    0    0    1      int min = start;
    2,005,000 1,002,000 500,500    .  .  .  .  .  .    for(int i = start+1; i <= stop; i++)
4,995,000 2,997,000       0    0   32    0    0   19    .        if (arr[i] < arr[min])
    6,144     3,072   3,072    .  .  .  .  .  .            min = i;
    1,000     1,000       .  .  .  .  .  .  .    return min;
    2,000     2,000       .  .  .  .  .  .  . }
        .       .     .  .  .  .  .  .  . void selection_sort(int arr[], int n)
        3         0       1    1    0    0    1    .  . {
    4,005     2,002   1,001    .  .  .  .  .  .    for (int i = 0; i < n; i++) {
    9,000     3,000   5,000    .  .  .  .  .  .        int min = find_min(arr, i, n-1);
    7,014,144 4,006,072 505,572    1   32    1    1   19    1  => sorts.c:find_min (1000x)
   10,000     4,000   3,000    .  .  .  .  .  .        swap(&arr[i], &arr[min]);
   15,000     9,000   4,000    1    0    0    1    .  . => sorts.c:swap (1000x)
        .       .     .  .  .  .  .  .  .    }
        2         2       .  .  .  .  .  .  . }
Tips and tricks
A few tips about using callgrind effectively:
- Ordinarily, we recommend that you debug/test on code compiled without optimization (i.e. -O0), but measuring performance is a bit different. You want to be executing the optimized code to find out what bottlenecks exist even with the compiler’s optimization help.
- Callgrind measures only that code which is executed, so be sure you are making diverse and representative runs that exercise all appropriate code paths.
- You can compare the results from multiple runs to understand the performance variation on different inputs.
- Callgrind records the count of instructions, not the actual time spent in a function. If you have a program where the bottleneck is file I/O, the costs associated with reading and writing files won’t show up in the profile, as those are not CPU-intensive tasks.
- If the compiler inlines a function, it will not appear as a separate entry. Instead, the cost of the inlined function will be included in the cost of the caller(s). Also remember that inline keyword is merely advisory; the compiler may inline or not as its discretion.
- You can limit callgrind to only count instructions within named functions by using the option
--toggle-collect=function_name. - The per-function annotation is often too coarse to be useful, the line-by-line counts are key for getting more helpful detail. You can even drop down to observe event counts at the assembly level. Build the code with assembly-level debug information by editing your Makefile to include compiler flags
-Wa,--gstabs -save-temps. Then when running callgrind, use the option--dump-instr=yeswhich requests counts per assembly instruction. When annotating this output, callgrind_annotate will now match events to assembly statements. Cool! - L2 misses are much more expensive than L1 misses, so pay attention to passages with high
D2mrorD2mwcounts. You can use callgrind_annotate show/sort options to focus on key events, e.g.callgrind_annotate --show=D2mr --sort=D2mrwill highlightD2mrcounts. - There are additional callgrind features that allow you to fine-tune the simulation parameters and control which/when events are collected, as well as many options for the annotator to configure how the report is presented. Refer to the online Callgrind manual for more details.
Using Git
Disclaimer: Most students won’t even notice or interact much with git during CS107. But for those of you who are curious to know more, here is an introduction to git.
You probably have seen the ubiquitous logo of github below(left), while rarely seeing the logo of git (right). Actually git is the workhorse behind the scene! git is a power tool in your arsenal as a software developer that lets you manage versions of your work.
![]()
Github

Git
The use of git in CS107
Version control is a tool used by developers to manage the source code in a project and git is one of the most popular version control systems in use today.
CS107 uses git to distribute starter code to you and receive your submissions for grading. Most of the interaction with git is hidden away within our tools. This means you won’t have to tackle learning the system now and will need only to learn a few simple commands for the quarter. However, you will eventually want to gain some mastery, so now could be your chance to practice with these tools in preparation for future need.
Your one git command
The one git command that you must know for CS107: git clone
Try running:
git clone /afs/ir/class/cs107/repos/assign0/$USER assign0
There is a remote repo already prepared for you at /afs/ir/class/cs107/repos/assign0/$USER, and you are fetching a local copy of that repo and putting it in a directory named assign0 in your current working directory.
The general format of the command is:
git clone <repo> <dirname>
and here is a specific instance to clone the lab1 starter:
git clone /afs/ir/class/cs107/repos/lab1/shared mylab1
This is the way that you will get starter code for every assignment and lab throughout this course.
When you are ready to submit, you will use our submit command:
tools/submit
This command submits your work to be graded; it uses git behind the scenes to copy your finished work into your class repo.
That’s it! If you are comfortable having our tools take care of you, you can stop reading right here and sleep easy knowing that version control is working behind the scenes for you.
Going further with version control (optional)
You won’t need to learn more for CS107, but if you are curious, below is an overview version control and introduction to a few basic git commands.
A version control system broadly does two things:
- It tracks all changes made to each file (which you can review to see your progress or undo if some changes turned out to be a bad idea)
- It can merge different versions (so team members can work independently and easily join their work together)
Version control allows you to explore changes while maintaining the option to undo them if they don’t work. Saved versions (along with regular testing) makes it easy to pinpoint what code changes are responsible for a new bug so you can focus your attention on fixing the right code. And if you accidentally delete a critical file or munge an important code passage, it can save the day and retrieve the old version. Without version control, you could attempt to manually track your project history by saving copies of files along the way but this is tedious and error-prone. Instead you can have a complete history from which you can snapshot/view/retrieve versions.
Git is one of most flexible and powerful version control systems in use, but its industrial-strength nature makes it less nice for novices. It can be easy to mess up the repo if not careful enough, so for now, it is best to stick to these simple and safe commands:
-
git status: After cloning, andcding into the repo, First try runninggit status, you should see:On branch master Your branch is up-to-date with 'origin/master'. nothing to commit, working directory cleanIf you edit a file, say
readme.txt, and rungit statusagain:Changes not staged for commit: (use "git add <file>..." to update what will be committed) (use "git checkout -- <file>..." to discard changes in working directory) modified: readme.txtwhich means that your change on the file has been detected by git, but not staged/added to git internal index.
-
git diff: as can be told from the command itself, it allows you to inspect what changes have been made from the last staged state. You may alsodiffon a single file, likegit diff readme.txt, and you should see something like this:--- a/readme.txt +++ b/readme.txt ---------------------- File: readme.txt Assignment: assign0 -Author: YOUR NAME HERE +Author: My Name ---------------------- -
git add: this command adds/stages the change you have made on certain files. Try runninggit add readme.txt, and you should see:Changes to be committed: (use "git reset HEAD <file>..." to unstage) modified: readme.txtWhich means that your update on
readme.txthas been added to the git index. Now it’s time to set a milestone! -
git commit: Acommitsets a milestone in the version history, a place you revisit later. Try runninggit commit -m "add name to readme.txt", and you will see:[master 5dd152e] add name to readme.txt 1 file changed, 1 insertion(+), 1 deletion(-)Here what’s after
-mis whatever message you’d like to comment for this commit. You may also just usegit commit, after which you may prepare a more verbose commit message in your editor. (Important aside:commitonly sets a milestone in your local repo. You still must submit your code to CS107 for grading using the submit tool! ) -
git log: This is the command to view your the commit history:commit 5dd152eff15d52598d990f775f9b5742fcf6d729 Author: dengl11 <dengl11@stanford.edu> Date: Mon Sep 25 20:59:51 2017 -0700 add name to readme.txt commit 6c09c2c89f1471e6204ce1bf64bcad2981770704 Author: CS107 tools <cs107@cs.stanford.edu> Date: Thu Sep 21 15:31:03 2017 -0700 Created starter 17-1 assign0 dengl11 commit 1399dc47471f304b0eef98aea1d119389f0ccfb0 Author: CS107 tools <cs107@cs.stanford.edu> Date: Thu Sep 21 15:31:03 2017 -0700 Init empty repo
For a tutorial on git, also check out the guided online tutorial from Try Git.
Common questions
What is the hidden .git directory and .gitignore file?
Sharp eyes! Every git repo has a .git hidden directory which stores the repo housekeeping, configuration settings, and complete version history. Do not delete this directory! It contains critical data for the repo.
The .gitignore file is lists files thare are intentionally excluded from being tracked. For example, .o files and executable programs are made when you compile (make). Those files can be quite large in size and there is no point in tracking their versions, since we can always rebuild from the original source code. To keep our git repo as light as possible, we exclude those files.
I don’t like the default editor popped up after I type git commit. Can I use my favorite editor, like Vim?
Yes! The following command configures which editor to use with git. (replace vim as emacs if you prefer):
git config --global core.editor vim
One last thought: git has an enormous set of features and the indiscriminate use of various commands can easily hose your repo. If you want to play around, be sure to do your experimentation on some throwaway repo, not your important assignment work, please!